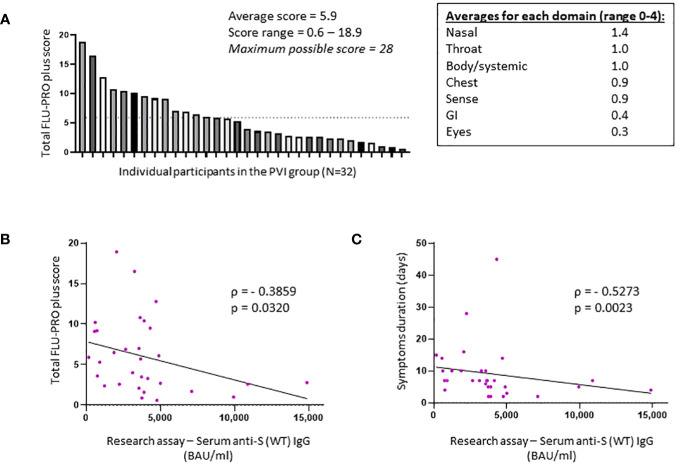
Figure 3.
Total FLU-PRO plus symptom scores and average scores for each symptom domain in the post-vaccine infection group. (A) Total FLU-PRO plus symptom scores for each participant in the post-vaccine infection (PVI) group (n = 32) and average scores for each symptom domain. The dashed line represents the average score of 5.9. (B) Correlation between research assay anti-S (WT) IgG serum levels (BAU/mL) and total FLU-PRO plus symptom scores (n = 31; Spearman ρ = −0.3859; p = 0.032). (C) Correlation between research assay anti-S (WT) IgG serum levels (BAU/mL) and total symptom duration of any symptom in days (n = 31; Spearman ρ = −0.5273; p = 0.0023). Dots indicate results from individual participants.

