
FIGURE 1.
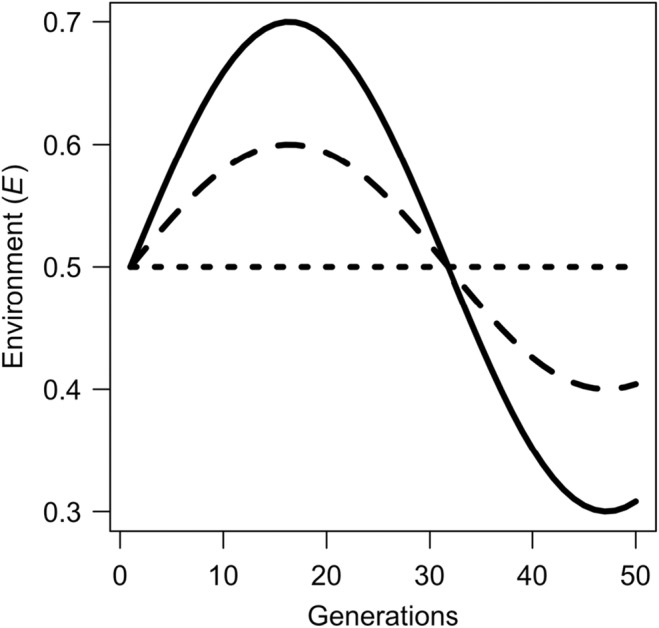
Variation in parameter through time when inter‐annual conditions are assumed to be: highly variable (solid line), somewhat variable (dashed line) and constant (dotted line).
Official websites use .gov
A
.gov website belongs to an official
government organization in the United States.
Secure .gov websites use HTTPS
A lock (
) or https:// means you've safely
connected to the .gov website. Share sensitive
information only on official, secure websites.
Variation in parameter through time when inter‐annual conditions are assumed to be: highly variable (solid line), somewhat variable (dashed line) and constant (dotted line).