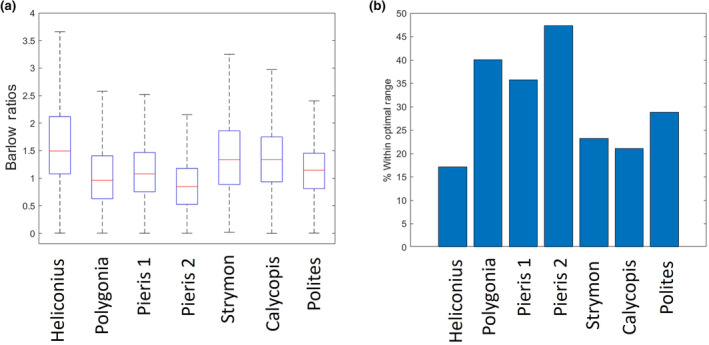
FIGURE 4.

(a) Boxplot showing the median (red line) Barlow ratio for the seven individuals. Boxes show interquartile range and whiskers show the lower and upper quartiles (Outliers are shown in Figure S2). (b) Bar plot showing the percentage of each portion of eye with a Barlow ratio that fell between 0.4 and 1.
