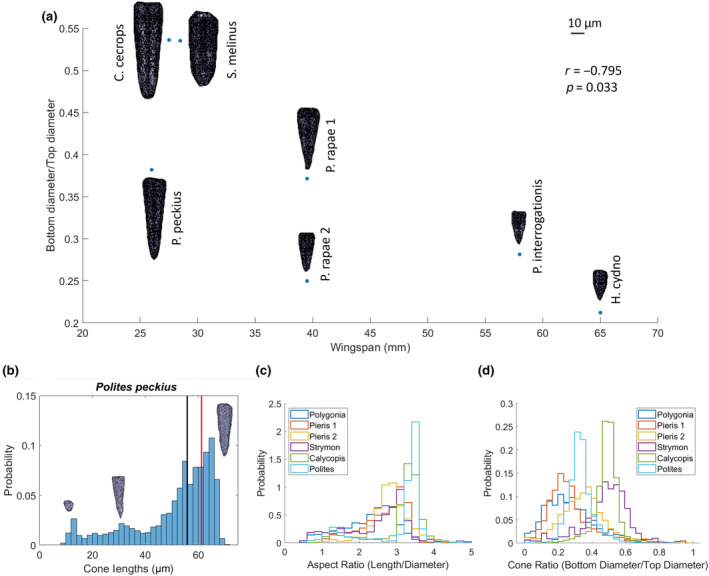
FIGURE 5.

(a) Cone shapes from all 7 individuals plotted by the length of the cone and the ratio of the diameter of the cone 10% from the bottom and the maximum width of the cone at the top. Scale bar shows 10 μm. Black line denotes the median cone length, while the red line shows the cone length of the typical cone. (b) Histogram showing the cone lengths across the eye of Polites peckius with example cones from the 3 different peaks in the distribution. (c) Histograms showing the aspect ratios and (d) cone ratios of each individual (excluding Heliconius as there were issues with individual cone segmentation in this dataset).
