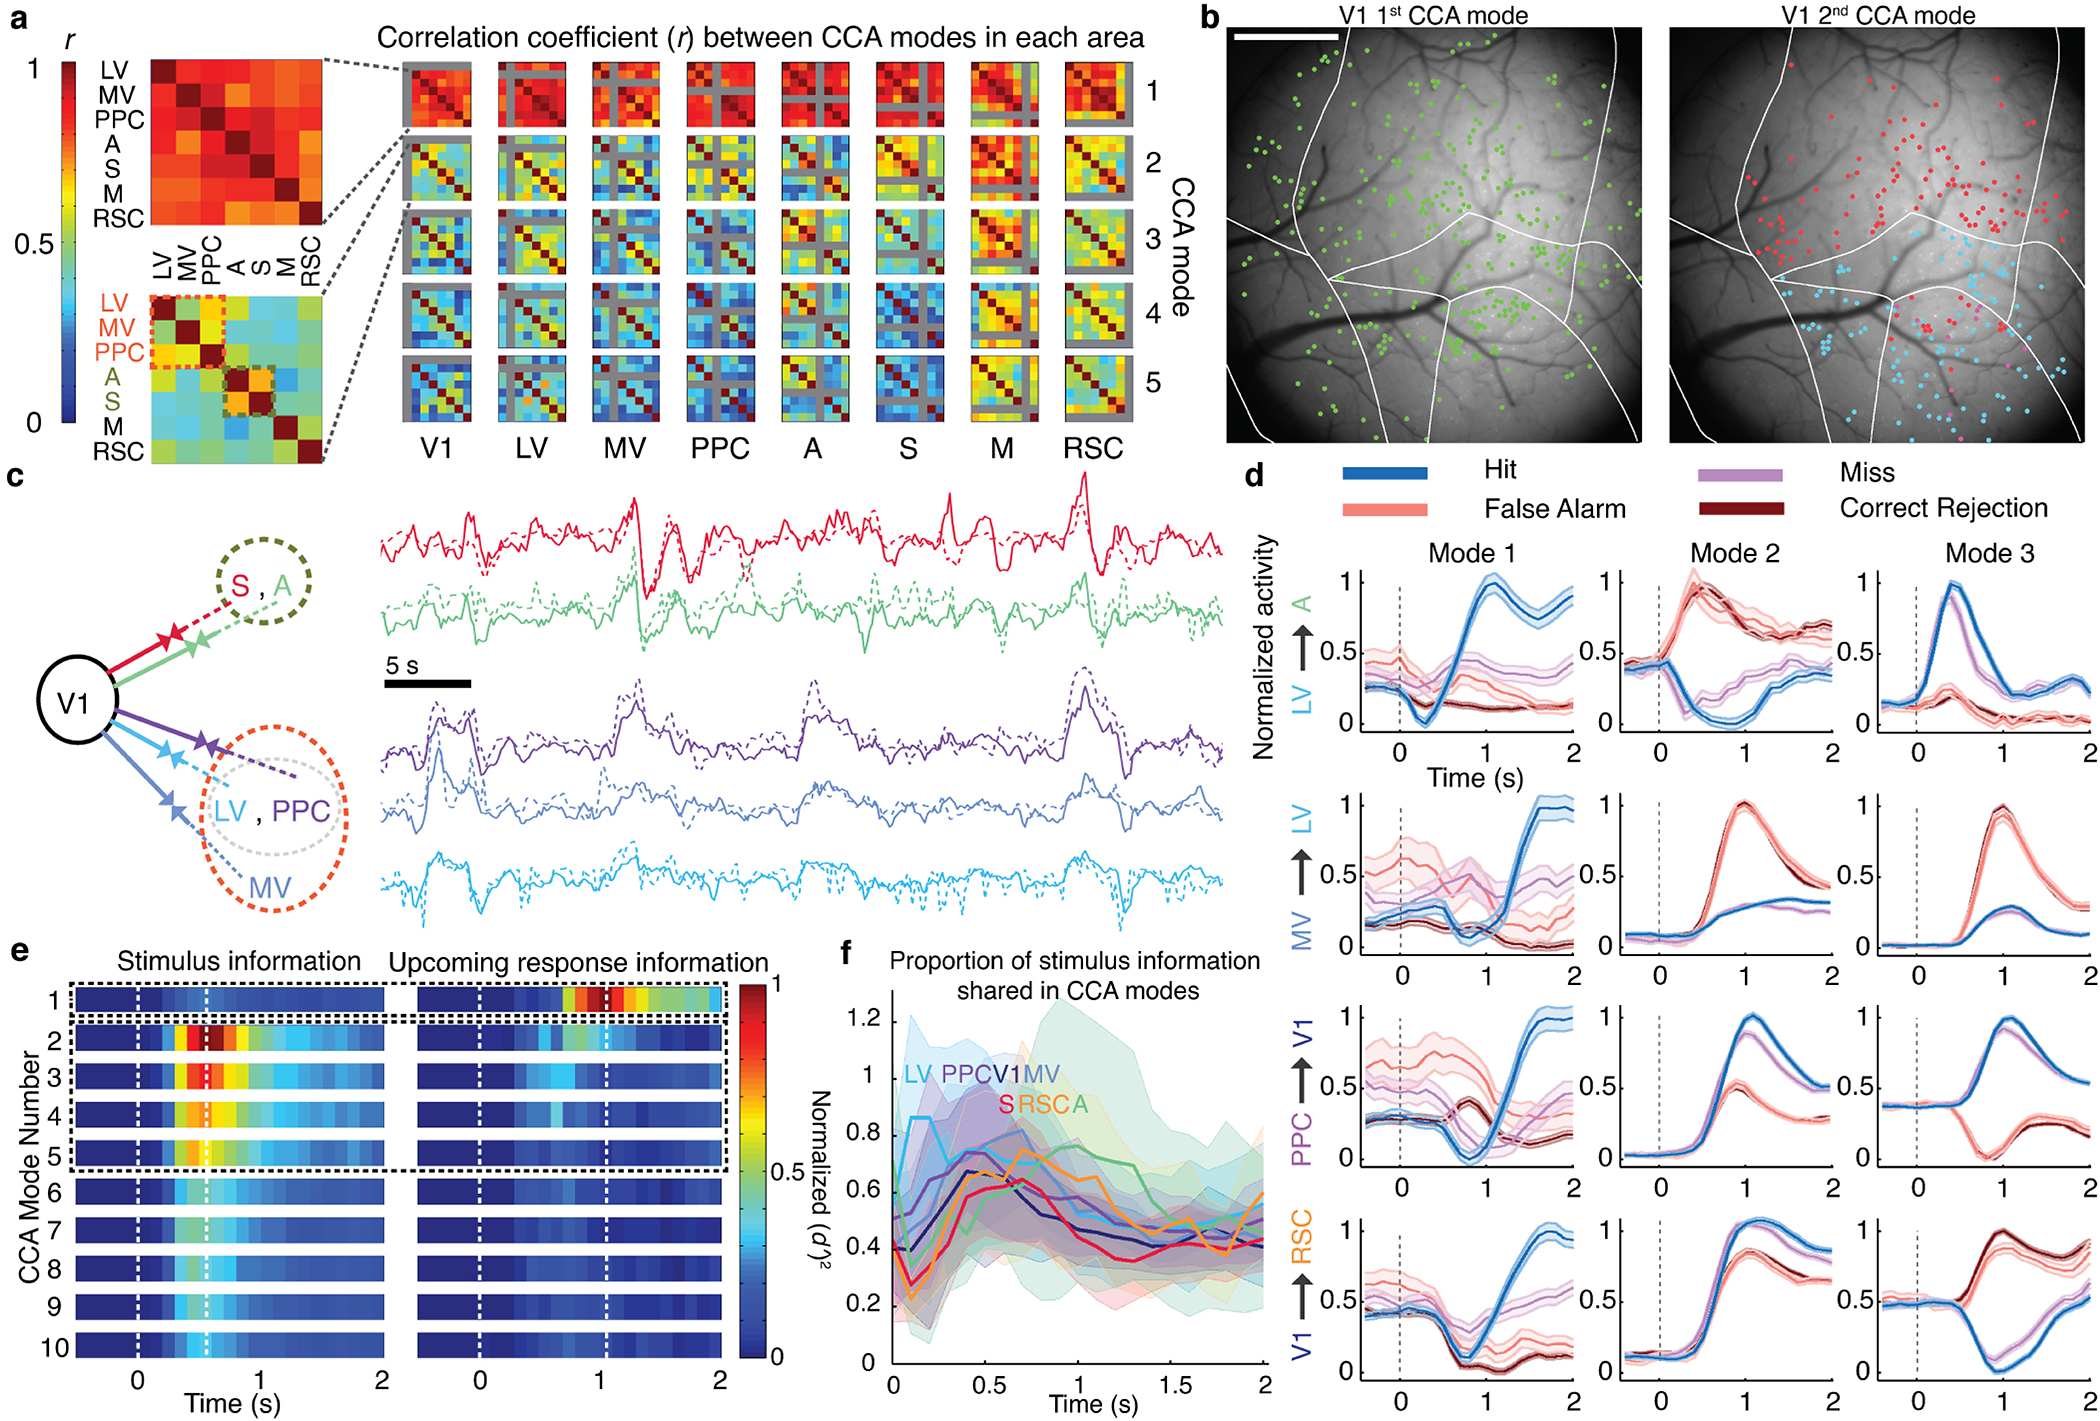
Fig. 5. Orthogonal inter-area co-fluctuations communicate sensory data and the mouse’s upcoming response.

(a) Each matrix shows correlation coefficients, r, for CCA modes between one of 8 source areas (listed at bottom) and 2 target regions (arranged as in the insets). A large matrix element value indicates the source co-fluctuated with the 2 targets using a similar activity mode; small values imply distinct co-fluctuation modes. Results are shown for the 5 largest CCA modes for each source/target pair, averaged over 6 mice. The largest CCA mode (top row) was largely invariant to source/target choices and thus globally shared across areas (mean r-values of the largest modes for individual mice were 0.99, 0.95, 0.85, 0.91, 0.92, 0.68). Insets: Magnified views for the largest CCA modes involving V1 and one of 7 other areas (top), and the second-largest modes between V1 and these other areas (bottom). In 5 of 6 mice there were at least 2 clusters (orange and olive fonts) of secondary modes with moderate similarity (schematized in c). Modes involving V1 and either LV, MV or PPC comprised one cluster; modes involving V1 and either area A or S comprised another.
(b) Left, Map of neurons (green) contributing significantly (weights deviating >2 s.d. from mean values) to the global fluctuation mode in one mouse. Right, Map of neurons in the 2 clusters of second-largest CCA modes involving V1 (see a,c). Cells marked red contributed to co-fluctuations between V1 and either S or A. Cells marked cyan contributed to co-fluctuations between V1 and either LV, MV or PPC.
(c) Left, Clustering revealed 2 subsets of target areas with similar second-largest CCA modes in V1, as seen in a,b. Right, 10 example activity traces for these modes, colored to match areas at left. Solid traces: Activity within the CCA mode in V1. Dotted traces: activity in the target area’s CCA mode.
(d) Aggregate neural Ca2+ signals in one mouse within the population vector dimensions determined by the largest 3 CCA modes (columns), for 4 different area pairs (rows) and trial outcomes (colored traces). Dashed line: stimulus onset. Ordinate values are shifted and normalized to lie within [0,1]. Shading: s.e.m. (N=100–678 trials).
(e) Right, The global fluctuation mode, identified in (a), lies in the dimension encoding information late in the stimulus period about the mouse’s upcoming response. Left, The second- to fifth-largest CCA modes lie in dimensions encoding stimulus-type. Results are from a CCA analysis of V1, LV, MV, PPC, A and S in which the cell ensembles significantly encoded stimulus-type or the mouse’s upcoming response (P<0.01; permutation test across trials of different types, using equal trials of each type (52–854 trials per type per mouse). We analyzed the 15 area pairs, projected activity in each area onto the dimensions identified, and computed how accurately ( )2 this activity subset encoded the stimulus-type (on Lick and No-Lick trials) or upcoming response (on Go trials). Plots show time-varying ( )2 values, averaged over both projections for each of 15 area pairs in 6 mice, for the 10 largest CCA modes. See also Extended Data Fig. 8.
(f) To determine the proportion of stimulus information shared via CCA modes, we plotted the total information encoded in CCA modes between a source (colored traces) and the other 7 areas, relative to the total information encoded within the source. Visual areas had a preponderance of their stimulus information encoded within CCA modes, especially early during stimulus presentation; ratios for non-visual areas peaked later in the trial. Shading: s.e.m. over 6 mice. See also Extended Data Fig. 9a.
