Figure 1.
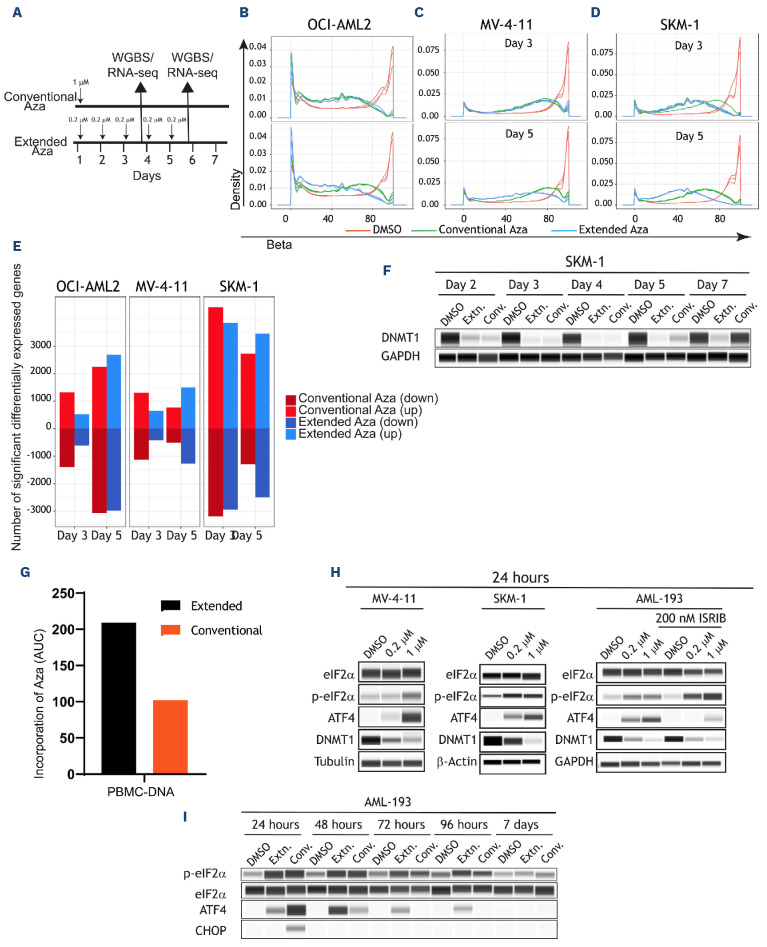
Extended-dose Aza leads to a more sustained hypomethylation and gene expression. (A) Schematic of experimental design of (B) OCI-AML2, (C) MV-4-11, and (D) SKM-1 cell lines DNA methylation profiles as measured by whole-genome bisulfite sequencing (WGBS) in response to the 2 dosing regimens. Compared to day 3, in day 5 extended dose results in a progressing/ sustained hypomethylation. (E) Barplots indicating the total number of significantly differentially expressed genes in all 3 cell lines at the 2 time points (day 3 and day 5). Three replicates per cell line, per time point, per gene was used to generate the barplots using the R limma package. Note the increase in the number of genes in extended dose but not in conventional dose azacitidine (Aza) at the later time point (“down” indicates downregulated and “up” indicates upregulated). (F) DNMT1 levels were measured by protein simple western blotting at the indicated times in SKM-1 cell line. (G) Area under the curve (AUC) barplots representing the amount of Aza incorporation in peripheral blood mononucear cells (PBMC) using the conventional or extended dose of Aza. AUC data was generated from 3 animals and 5 time points for each dosing regimen (H) Biochemical analysis was performed in MV-4-11, SKM-1, and AML-193 cells treated with low (0.2 µM) or high (1 µM) dose of Aza for 24 hours. Protein lysates were prepared and assessed for treatment-mediated activation of ISR and loss of DNMT1. AML-193 experiment was duplicated (right panel) to assess the effect of ISRIB, an ISR inhibitor, in ablating Aza-induced ISR activation. Tubulin or glyceraldehyde-3-phosphate dehydrogenase (GAPDH) was used as a loading control. (I) AML-193 cells were treated with Aza in conventional or extended regimen and protein lysates were prepared from days 1-7 and assessed for DNMT1 expression and ISR activation markers. EIF2α was used as a loading control. RNA-seq: RNA sequencing.

