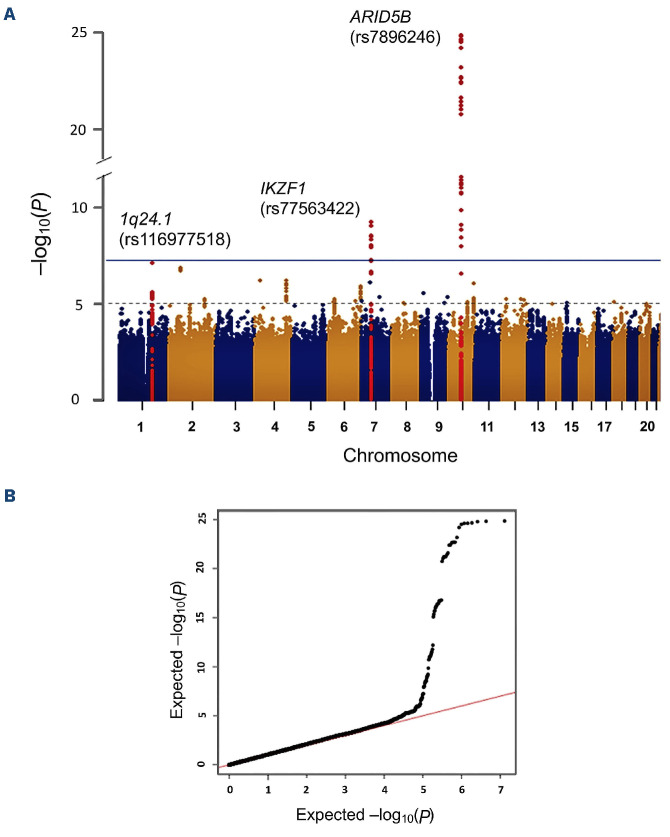
Figure 1.
Results of meta-analysis combining the TCCSG and JPLSG genome-wide association analysis results. (A) The Manhattan plot shows the -log10 (P value) of the logistic regression analysis plotted against the chromosomal position (GRCh37/ hg19). The blue line indicates the genome-wide significant P value threshold of 5x10⁻⁸, and the dotted line was the threshold (1x10⁻⁶) for considering results as suggestive. (B) A quantile-quantile plot of the observed versus expected distribution of the -log10 (P value) from the analysis. TCCSG: Tokyo Children Cancer Study Group; JPLSG: Japanese Pediatric Leukemia/Lymphoma Study Group.

