
FIGURE 4. Alp1 promotes AHR independent of PAR2.
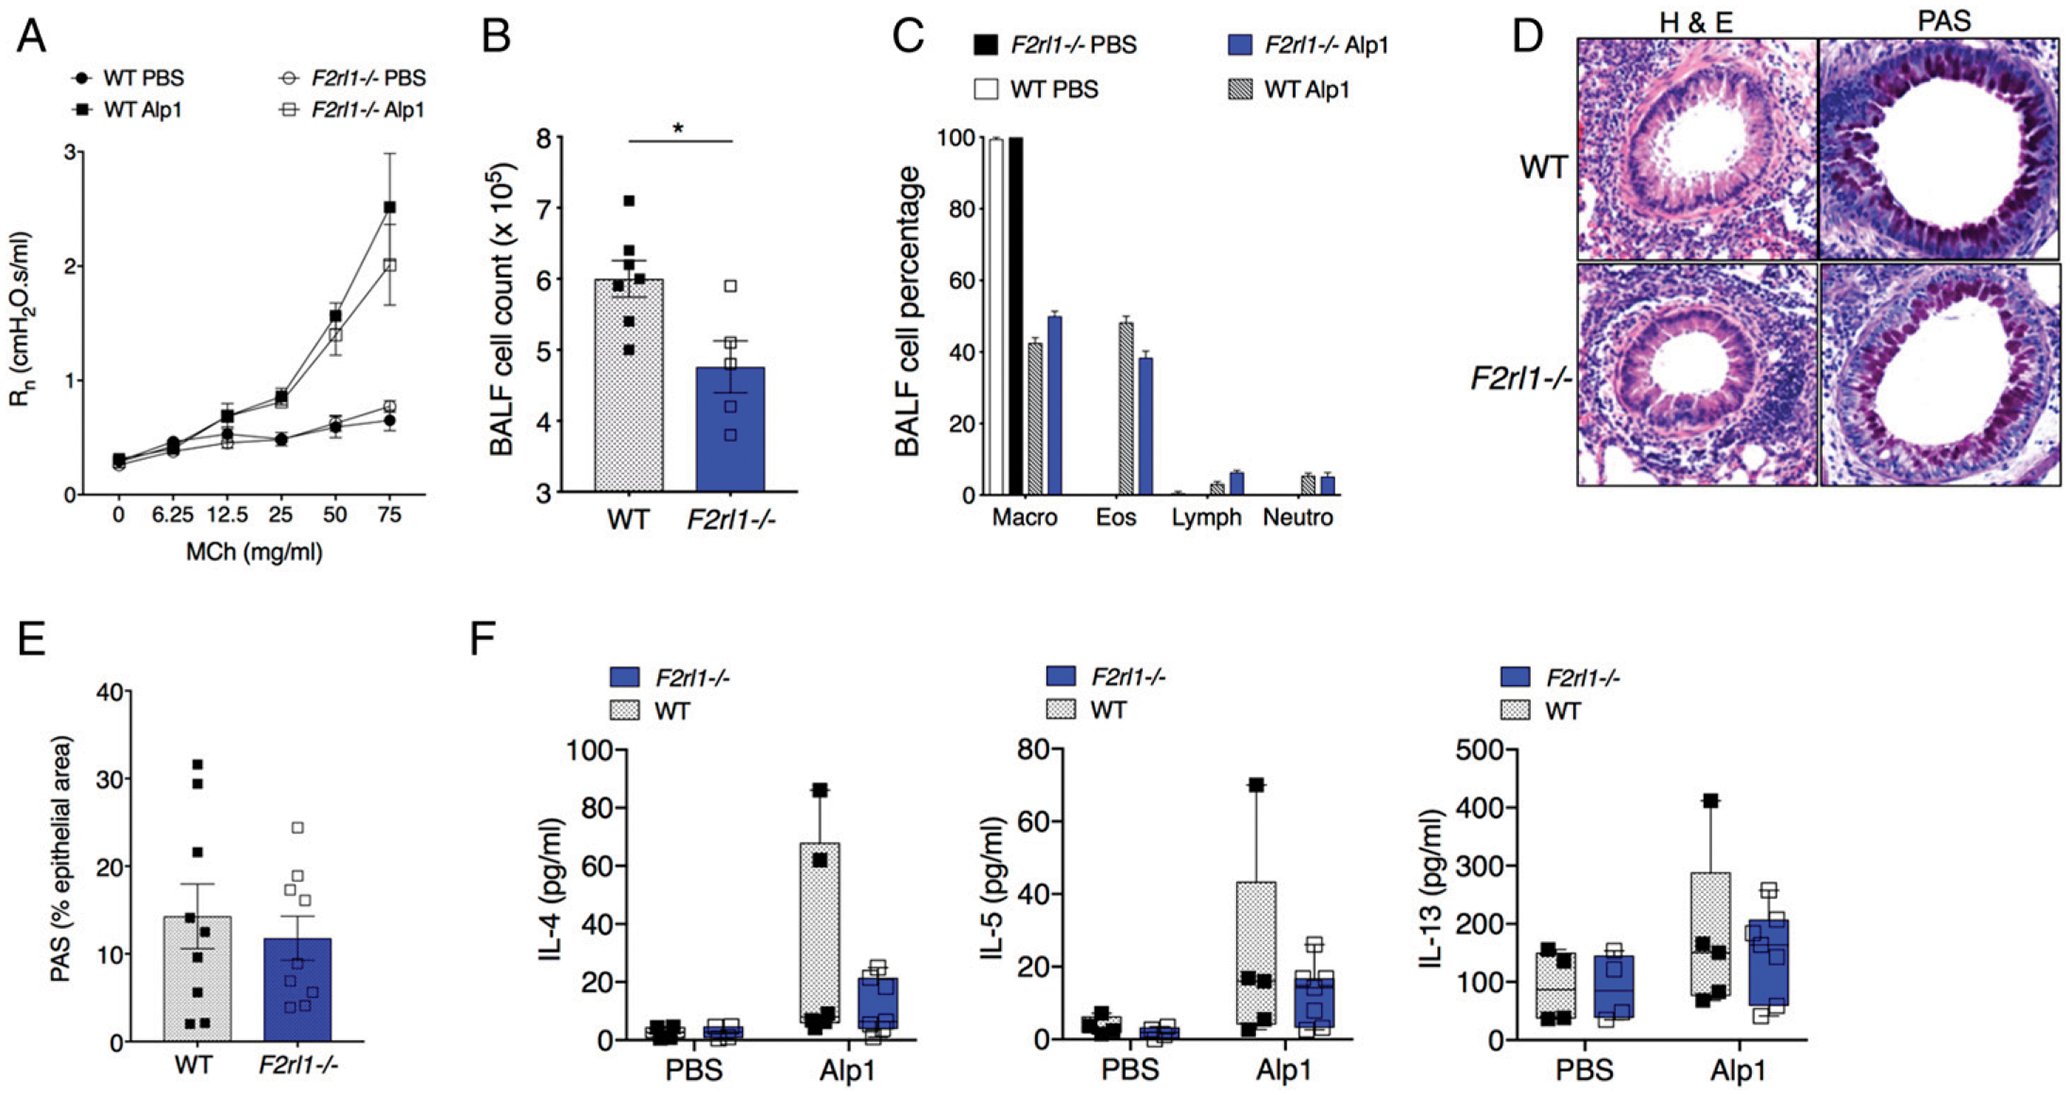
(A) R in Alp1-challenged F2rl1−/− mice that lack PAR2 expression (two to seven mice per group). (B and C) Total cell counts (B) and cell composition (C) in BALF. (B) *p = 0.01, unpaired t test. (D) Lung inflammation and airway mucin evaluated by H& E (left) and PAS (right) staining. Images are representative of three to five mice per group. Original magnification ×10. (E) PAS+ area within the airway epithelium. (F) IL-4, IL-5, and IL-13 levels in BALF. All symbols in bar graphs represent results from an individual mouse; error bars are mean ± SEM.; all results represent at least two independent experiments.