Figure 6.
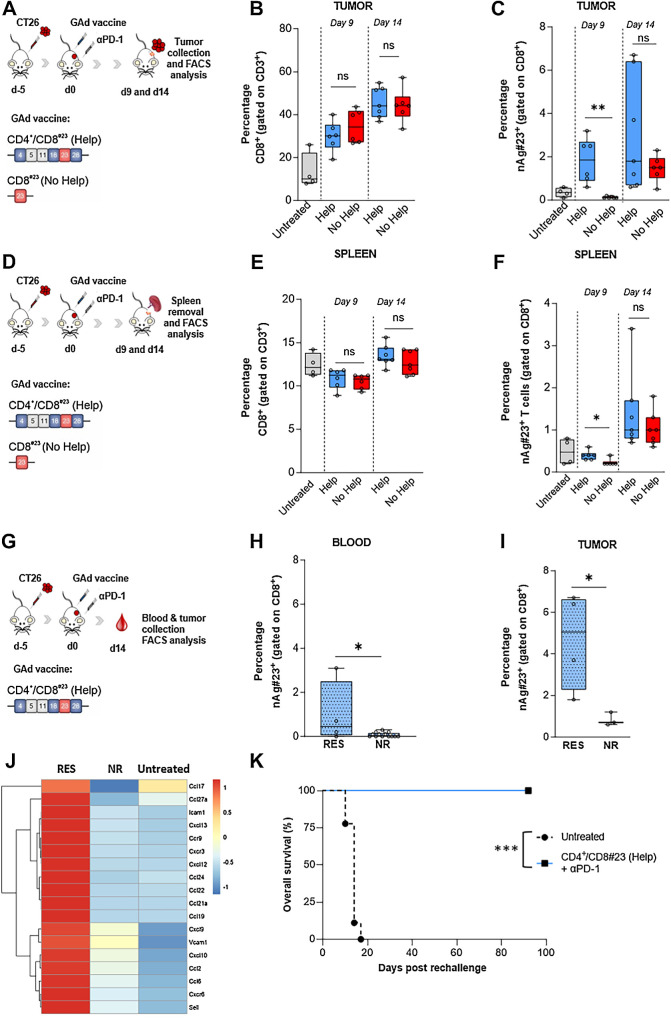
The presence of CD4 Help increases intratumoral antigen-specific T cells. A, Schematic representation of the experiments. Mice were subcutaneously injected with CT26 cells and 5 days later, immunized with GAd vaccines CD4+CD8#23 (Help) and CD8#23 (No Help) in combination with anti-PD1. At days 9 and 14 after vaccination, tumors were collected for FACS analysis. The percentage of intratumoral CD8+ T cells (B) and nAg#23+-specific T cells (C) is shown (Untreated, n = 4; Help day 9, n = 6; no Help day 9, n = 6; Help day 14, n = 7; no Help, n = 7). Statistical differences were calculated with two-tail Mann-Whitney (**, P = 0.002). D, Schematic representation of the experiments. Mice were subcutaneously injected with CT26 cells and 5 days later, immunized with GAd vaccines CD4+CD8#23 (Help) and CD8#23 (No Help) in combination with anti-PD1. At days 9 and 14 after vaccination, spleens were collected for splenocytes isolation and FACS analysis. The percentage of CD8+ T cells (E) and nAg#23+ specific T cells (F) is shown (Untreated, n = 4; Help day 9, n = 6; no Help day 9, n = 6; Help day 14, n = 7; no Help, n = 7). G, Schematic representation of the experiments. Mice were subcutaneously injected with CT26 cells and 5 days later, immunized with GAd vaccine CD4+CD8#23 (Help) in combination with anti-PD1. At day 14 after vaccination, blood (H) and tumors (I) were collected for FACS analysis of nAg#23+-specific T cells, in responder (RES, n = 4) and nonresponders mice (NR, n = 13 for blood and n = 3 for tumors). Results are expressed as percentage (%). Statistical differences were calculated with one or two-tail Mann–Whitney (*, P< 0.05; ns, not significant). J, Heat map displaying the relative (median log2-fold change) expression of selected chemokines, chemokine receptors and adhesion genes associated with T-cell infiltration and chemotaxis, between responders (RES, n = 5) and nonresponders (NR, n = 4) tumors to Help vaccine in combination with anti-PD1, compared with the untreated group (n = 3). The color gradient indicates the normalized values (z-score) of the median gene values. K, Tumor-free mice treated with CD4+CD8#23 (Help, n = 5) and anti-PD1 were re-challenged with a second CT26 tumor inoculum at day 40 after first challenge. Untreated mice were inoculated with CT26 tumor cells as control (n = 9). Log rank test ***, P = 0.0005. Data are representative of three independent experiments.

