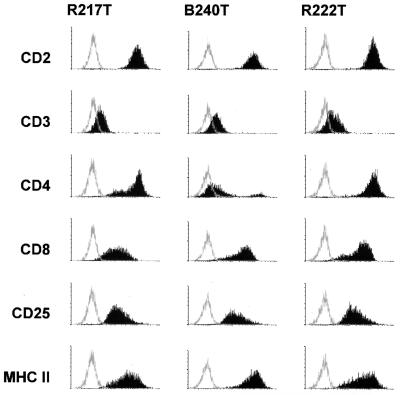
FIG. 2.
Surface phenotype of tumor cell lines. The surface phenotype is shown for the thymus derived T-cell lines R217T (wild type-infected), B240T (deletion mutant 14-3.11), and R222T (deletion mutant 14-4.6). The histograms show fluorescence intensity in logarithmic scale on the x axis and cell numbers in linear scale on the y axis. MHC, major histocompatibility complex.

