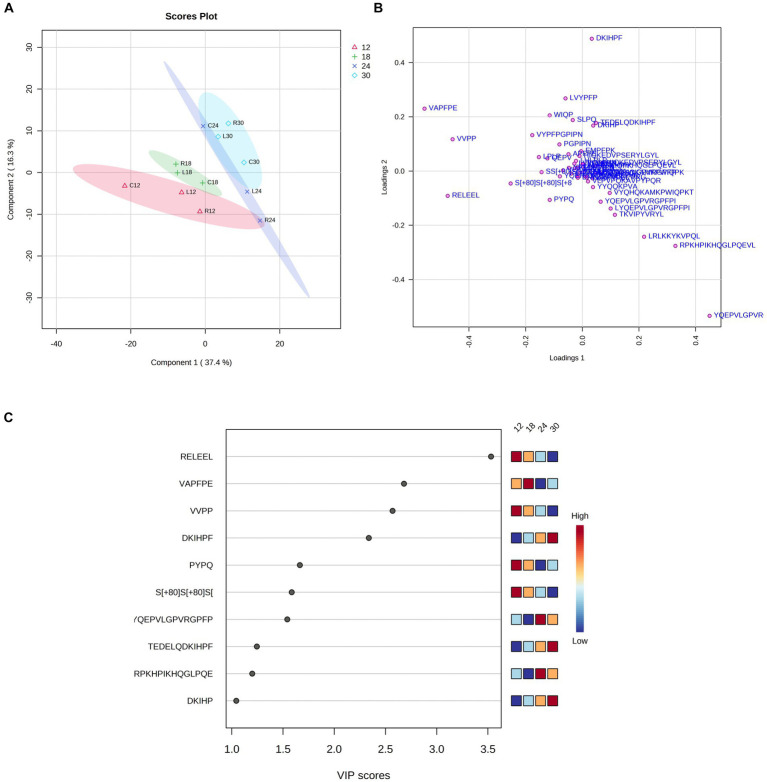
Figure 14.
Partial least squares discriminant analysis (PLS-DA) of the bioactive peptide profile from dairies C, L, and R. Scores (A) and loadings (B) were analyzed at different ripening times (12, 18, 24, and 30 months). (C) Bioactive peptides with a VIP score > 1 were found throughout cheese ripening by PLS-DA analysis.

