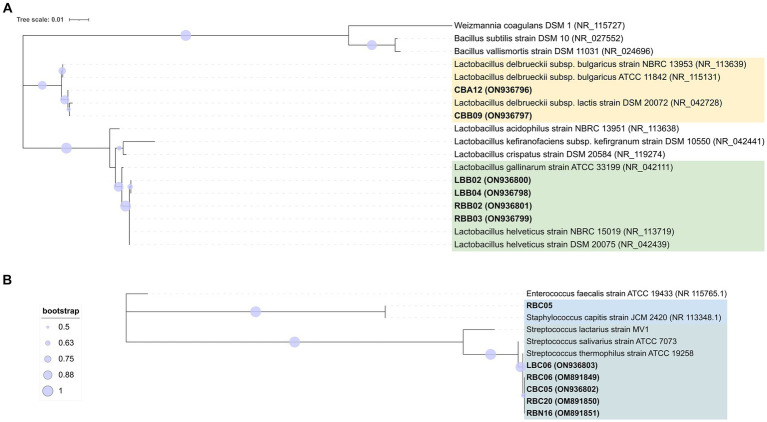
Figure 3.
Phylogenetic trees based on 16S rRNA gene sequences showing the relationship among rod-shape (A) and cocci (B) SLAB strains isolated from three NWS samples and the related neighbor’s species. The trees were inferred using the maximum likelihood method and the Kimura’s two-parameter model (Kimura, 1980) with Mega X software (Kumar et al., 2018). Representative isolates for each sample are shown with the sequence accession numbers indicated in brackets, while the sequence data of reference strains were from the NCBI RefSeq database. A discrete Gamma distribution was used to model evolutionary rate differences among sites. Bootstrap values are indicated at branch points based on 1,000 replications. Bootstrap values below 50% are not shown. Bar: 0.01 substitutions per nucleotide position. The trees are drawn in scale, with branch length measured in the number of substitutions per site. The trees were rooted using the branch leading to three outgroup species: W. coagulans, B. subtilis, and B. vallismortis for the panel (A) and E. faecalis for the panel (B).

