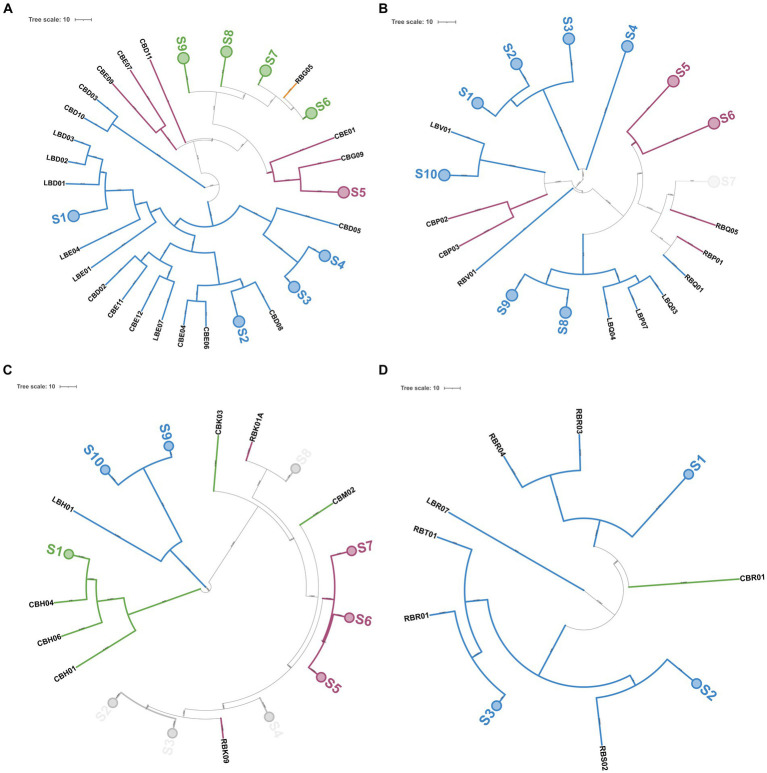
Figure 9.
Genotyping of 189 NSLAB isolates from PR cheese samples. Trees (A–D) represent NSLAB isolates from 12, 18, 24, and 30 months of ripening, respectively. Dendrograms of (GTG)5-PCR fingerprints were built according to the Pearson correlation coefficient and UPGMA. In each tree, collapsed clades (S) represent clusters with more than 91% similarity coefficient. Each knot shows the length of the arms. Colors were according to the species, as follows: blue, Lcb. paracasei; pink, Lcb. rhamnosus; green, Lcb. zeae; and light gray, mixed group. The tree was visualized with ITOL (Letunic and Bork, 2019).

