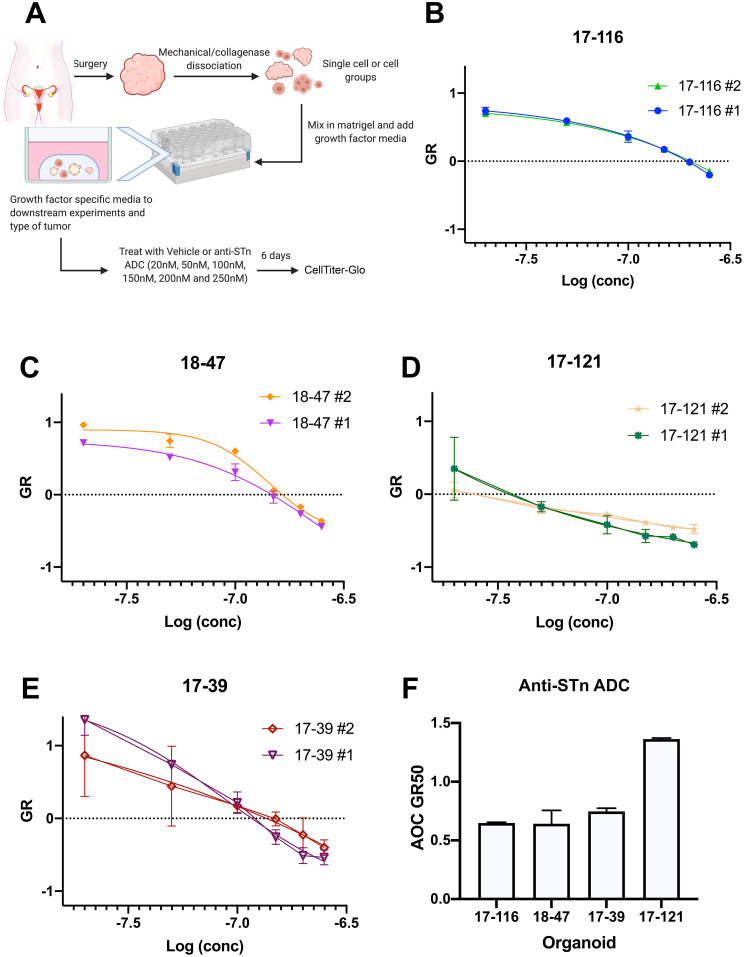
Fig. 2.
Assessment of anti-STn-ADC effects in a panel of HGSOC PDOs. The PDOs were treated with either vehicle or increasing concentrations of anti-STn-ADC on day 1. Each organoid was treated as two individual repeats for each line and cultured for 6 days (3 replicates per dose in each repeat). An untreated series of wells was read on day 1 to compare to the day 6 treated wells to allow for mathematical growth rate correction (Panel A). Figure 2B, C, D, and E represent the area over the growth rate corrected dose curve (AOC) for each organoid line demonstrating its sensitivity to treatment with anti-STn-ADC compared to its vehicle control. Figure 2F illustrates the AOC GR50 of anti-STn -ADC in each line

