FIGURE 3.

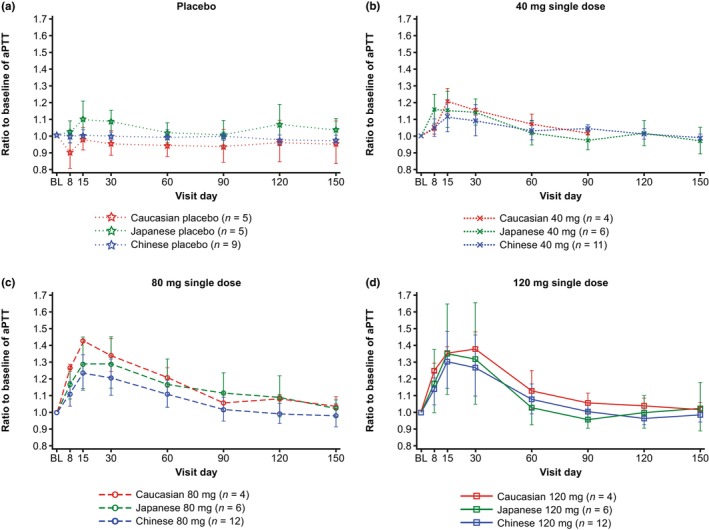
Geometric means with standard deviation range for the ratio to baseline of aPTT in plasma over time. (a) With placebo and (b–d) with 40 mg, 80 mg, and 120 mg doses. aPTT, activated partial thromboplastin time; BL, baseline.

Geometric means with standard deviation range for the ratio to baseline of aPTT in plasma over time. (a) With placebo and (b–d) with 40 mg, 80 mg, and 120 mg doses. aPTT, activated partial thromboplastin time; BL, baseline.