FIGURE 4.

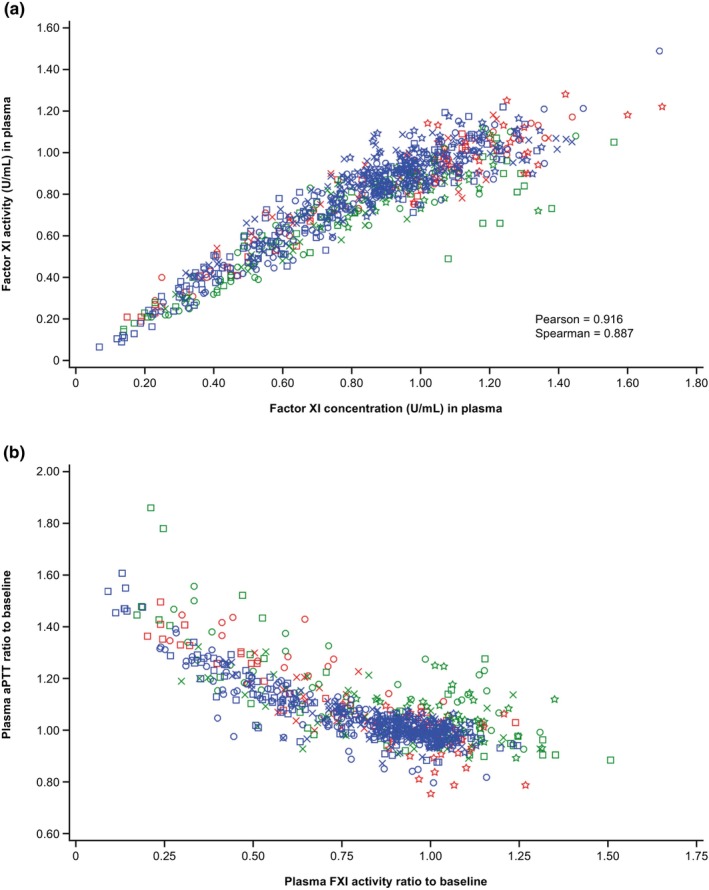
Correlation of FXI activity and FXI concentration (a); and correlation of aPTT and FXI activity (b). All available time points are included in the plots. aPTT, activated partial thromboplastin time; FXI, factor XI.

Correlation of FXI activity and FXI concentration (a); and correlation of aPTT and FXI activity (b). All available time points are included in the plots. aPTT, activated partial thromboplastin time; FXI, factor XI.