Fig. 2.
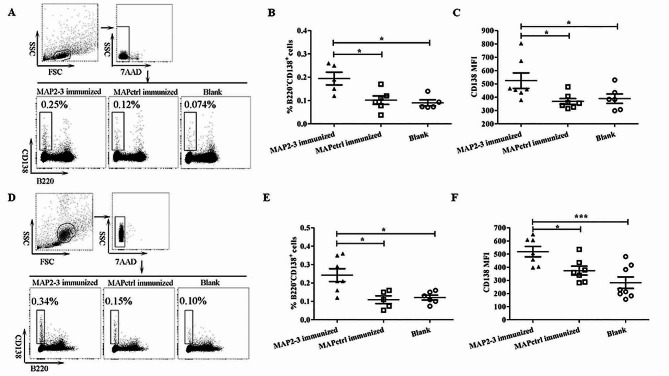
Detection of plasma cells (B220− CD138+ cells) in the spleen and bone marrow. (A) Gating strategy and representative FACS of plasma cells in the spleen. (B) The percentage of plasma cells in the spleen. MAP2-3 vs. MAPctrl: p = 0.022; MAP2-3 vs. Blank: p = 0.016. (C) MFI of CD138 was examined using B220− CD138+ cells in the spleen. MAP2-3 vs. MAPctrl: p = 0.015; MAP2-3 vs. Blank: p = 0.038. n = 5–7 mice/group. (D) Gating strategy and representative FACS of plasma cells in the bone marrow. (E) The percentage of plasma cells in the bone marrow. MAP2-3 vs. MAPctrl: p = 0.026;MAP2-3 vs. Blank: p = 0.034. (F) MFI of CD138 was examined using B220− CD138+ cells in the bone marrow. MAP2-3 vs. MAPctrl: p = 0.021; MAP2-3 vs. Blank: p = 0.0004. n = 5–8 mice/group. p-values: * p < 0.05, *** p < 0.001

