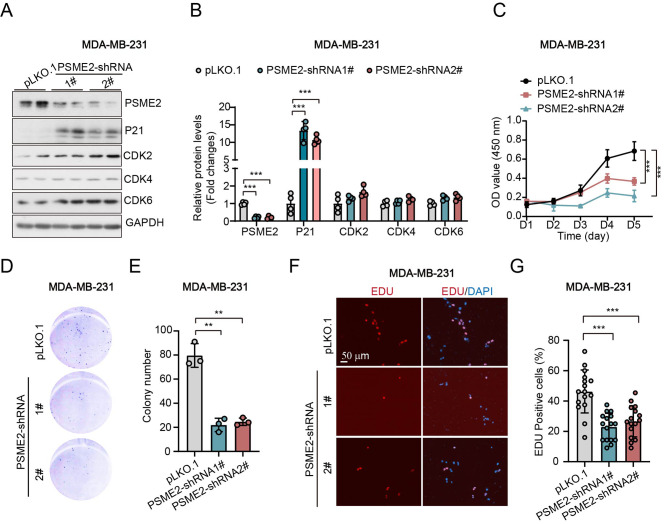
Fig. 4.
Knockdown of PSME2 represses cell growth and clone formation in MDA-MB-231 cells. (A-B) Western blots and quantitative results of PSME2 and the indicated proteins in MCF-7 cells. (C) Cell viability measurement by CCK8. (D-E) Images and quantitative results of cell clone. (F-G) Images of EDU staining and the quantitative results. pLKO.1: the normal control cells; PSME-shRNA1/2: two PSME2 knockdown cell lines. (**: p < 0.01; ***: p < 0.001). (Western blot results in Fig. 4A were cropped from the raw data in Supplementary Info File)

