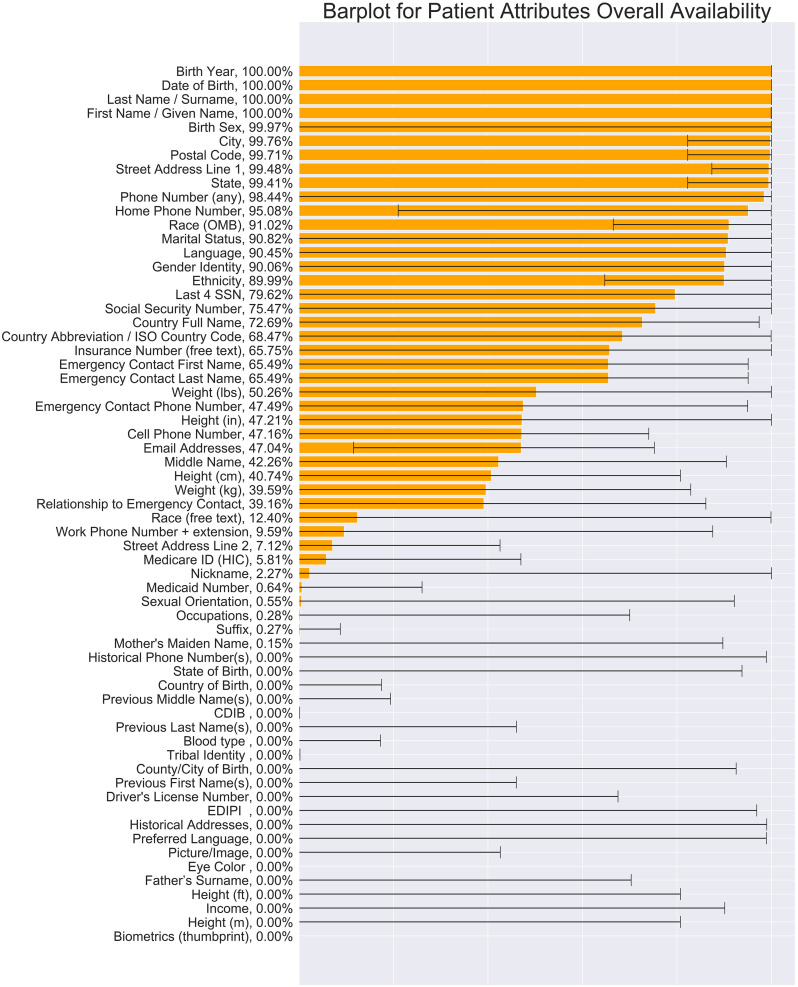
Figure 1.
Overall percentage of the availability of patient attributes. The bar plot shows the minimum, median, and maximum values of the overall availability of each patient attribute across sites. From bottom to top, the order of patient attributes is sorted by the value of median overall availability. The number to the right of each attribute name is the median overall percentage availability for that attribute. The left side of the black line on top of each bar represents the minimum value, and the right side of the black line on top of each bar represents maximum value among sites. Source: Authors’ analysis of data from query. Abbreviations: CDIB, Certificate of Degree of Indian or Alaskan Blood; EDIPI, Electronic Data Interchange-Personal Identifier; HIC, Health Insurance Claim Number; ISO, International Organization for Standardization; OMB, Office of Management and Budget; SSN, social security number.

