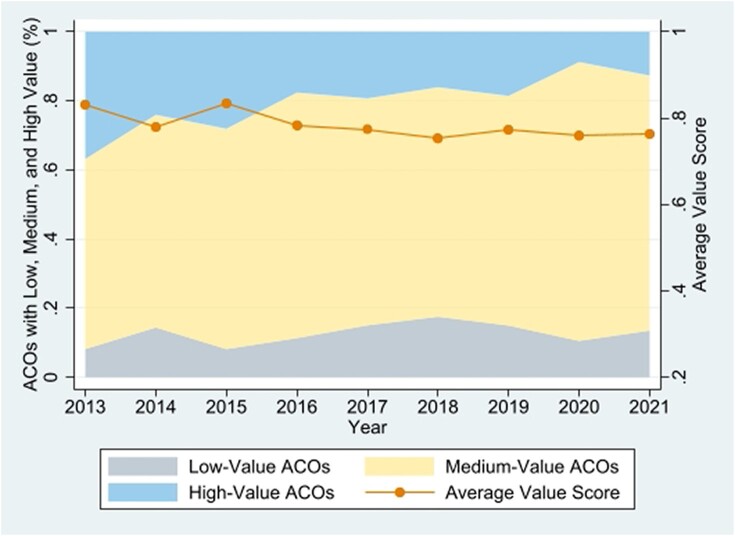
Figure 1.
Trends in health care value of accountable care organizations (ACOs), 2013–2021. Source: Authors’ analysis of data from the Medicare Shared Savings Program public use files from 2013 to 2021. One standard deviation above and below average were used as thresholds to determine high and low value, respectively.

