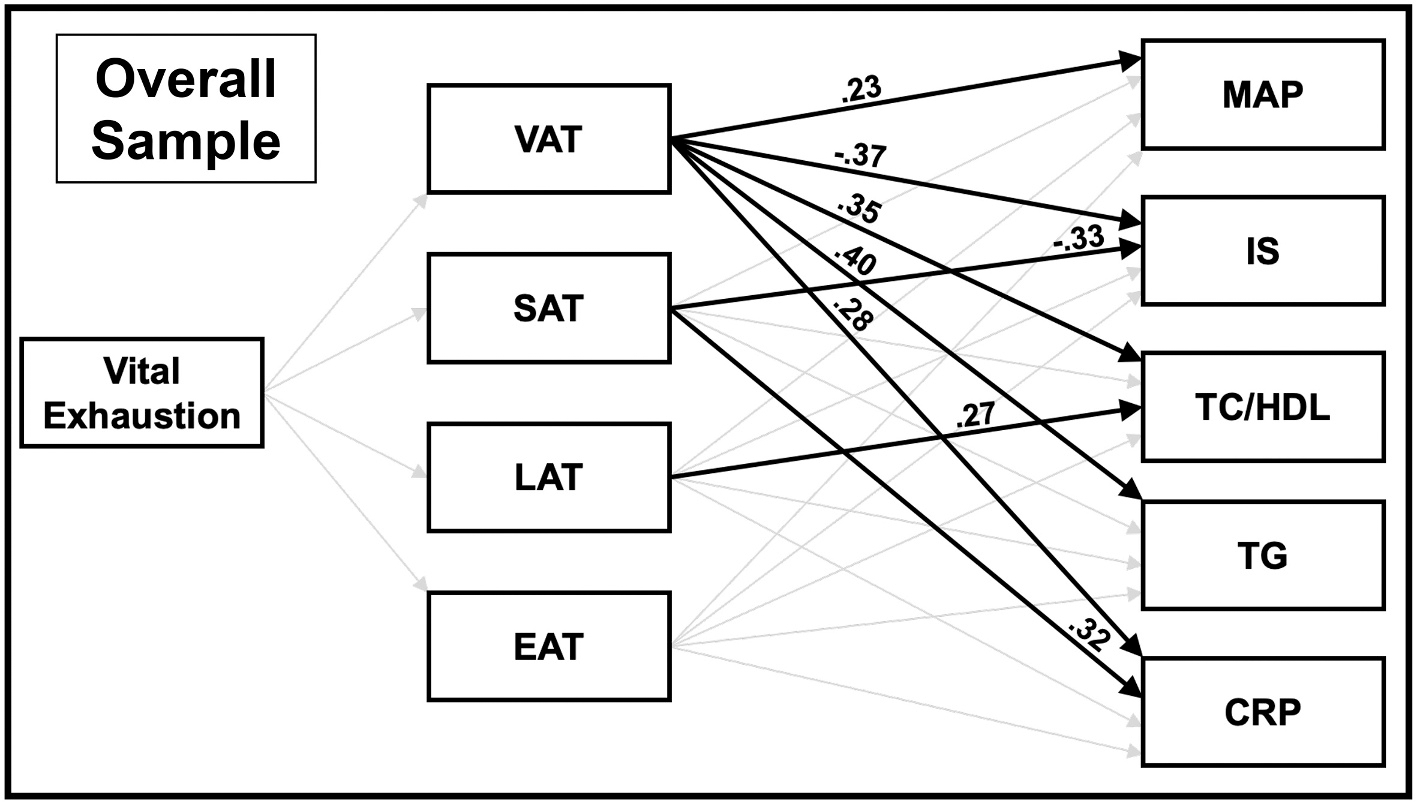
Fig. 1.

Path analysis model of the overall sample depicting the mediation by regional fat depot of the pathway from vital exhaustion to the CVD risk indices. Direct paths from vital exhaustion to MAP, IS, TC/HDL, TG, and CRP are not displayed in figure (all were nonsignificant, except the path from vital exhaustion to TC/HDL, which approached significance [β = −0.13, p = .06]). Covariates in the model included age, education, and fitness. Paths that were significant are indicated by a solid bold line; paths that approached significance (p < .10) are indicated by a dotted line; and paths that were not significant are indicated by a faded line. Direct paths in this figure are displayed prior to bootstrapping analyses for assessment of mediation. Abbreviations: VAT visceral adipose tissue, SAT subcutaneous adipose tissue, LAT liver adipose tissue, EAT epicardial adipose tissue, MAP mean arterial pressure, IS insulin sensitivity, TC/HDL total cholesterol to high-density lipoprotein ratio, TG triglycerides, CRP C-reactive Protein.
