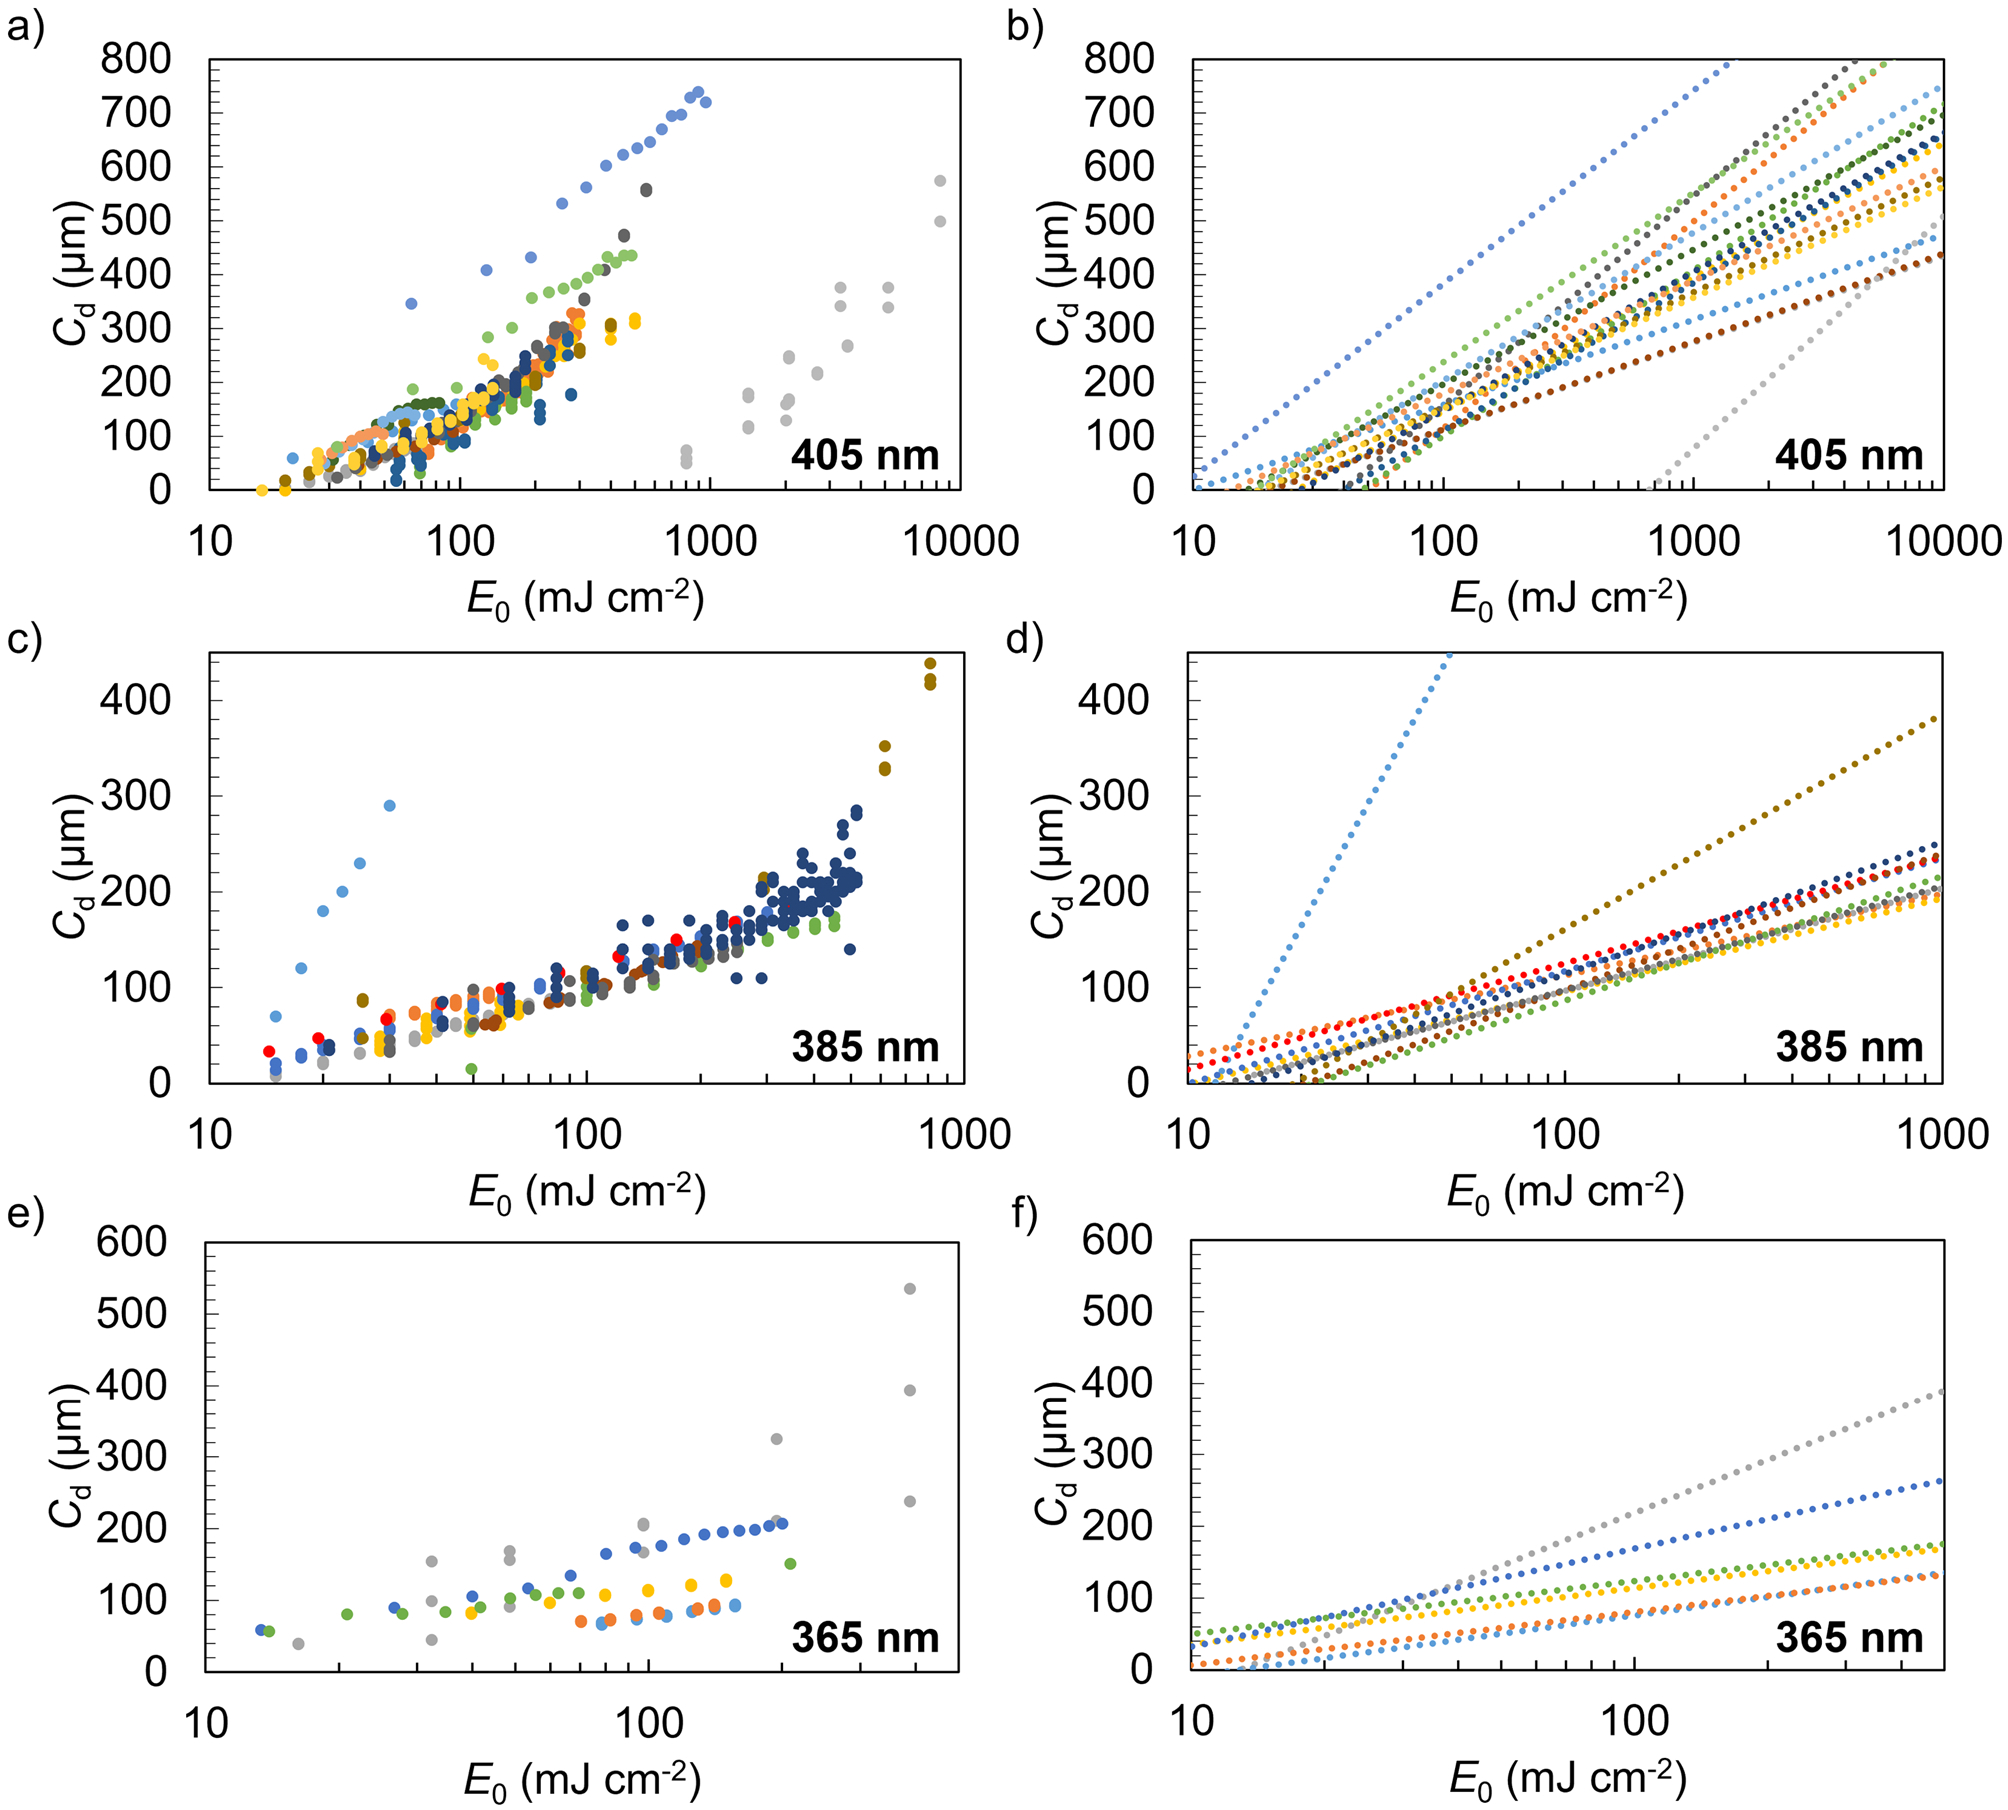
Fig. 1.

Cure depth Cd vs exposure E0 data reported by study participants at nominal wavelengths (a) 405 nm, (c) 385 nm, and (e) 365 nm. Fits to the Jacobs equation are shown in panels (b), (d), and (f) to highlight the origin of the scatter in Dp and Ec.
