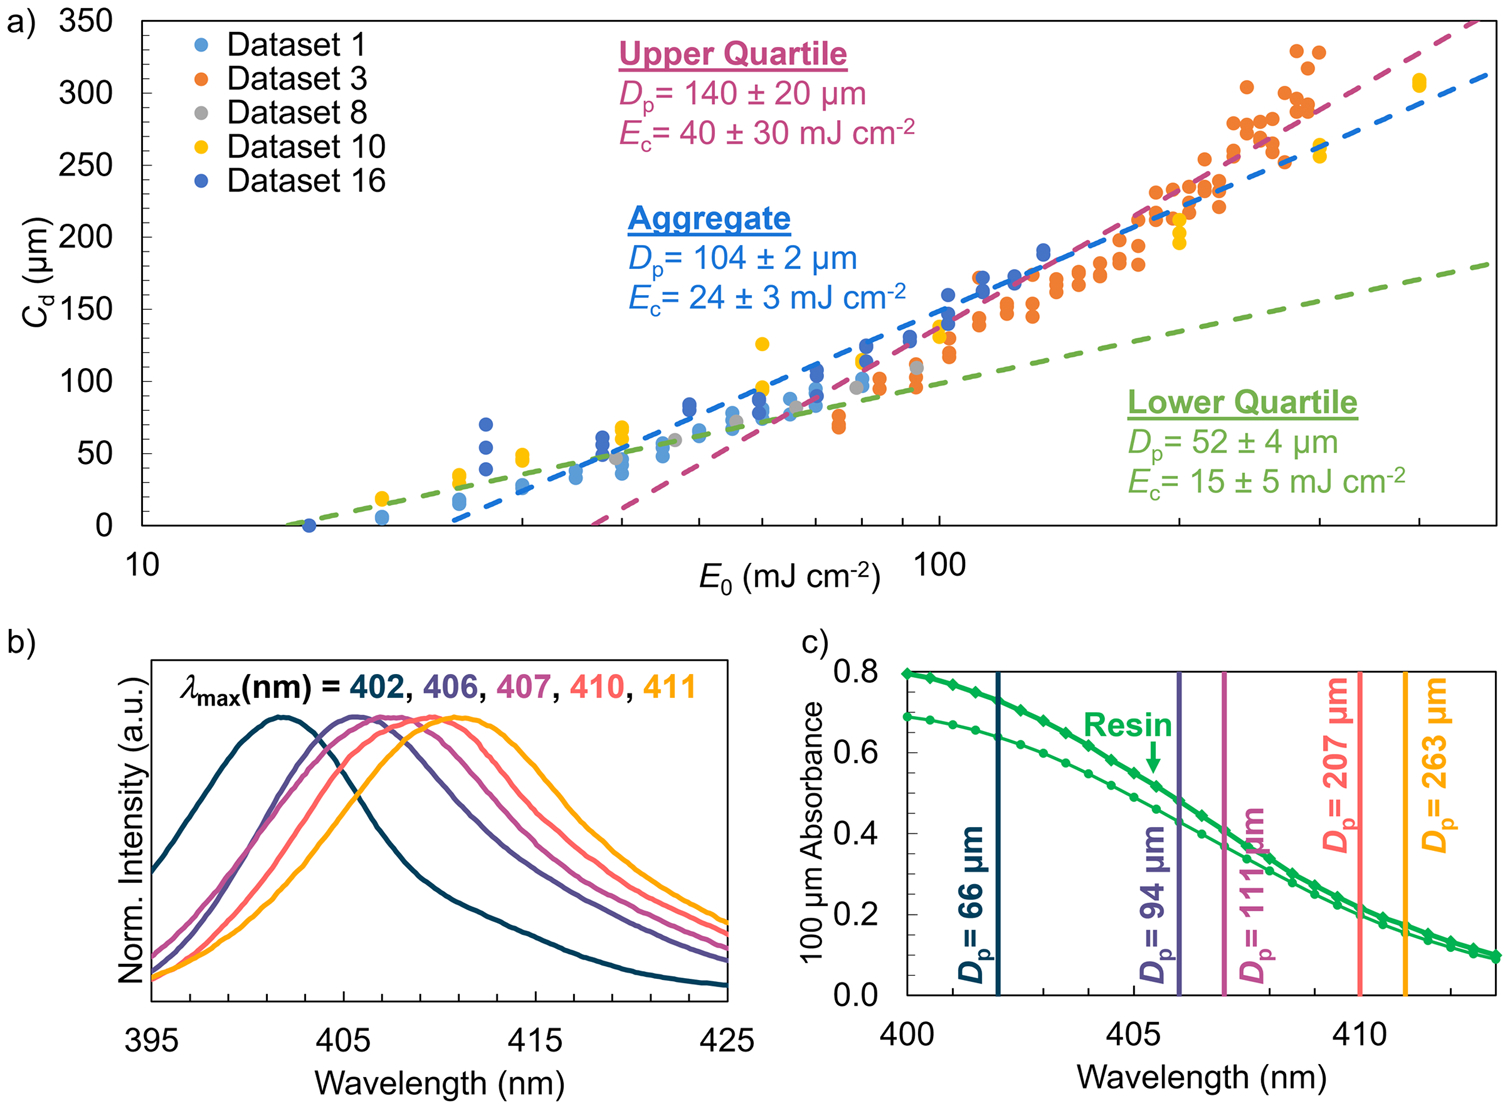
Fig. 3.

(a) Down-selected 405 nm dataset collected from ILS participants. The separate fits to the Jacobs model are shown for the lower quartile, upper quartile, and entire range (aggregate) of the data. The fit parameters and uncertainties are displayed in the plot area. The Dp values span a range of 52 μm to 140 μm, while the Ec values span a range of 15 mJ cm−2 to 40 mJ cm−2 for the different ranges of the same data. This variation in fit values highlights epistemic uncertainty in the working curve measurement. (b) Spectra from five nominally 405 nm printers showing nearly 10 nm variation in peak wavelength λmax. (c) Green traces are UV/Visible spectra of the studied resin collected on a variable pathlength spectrometer (circles) and in a conventional spectrometer with a 100 μm cuvette (diamonds). The “optical” Dp that is extracted from the absorbance data are shown for each of the peak wavelengths in the LEDs shown in (b).
