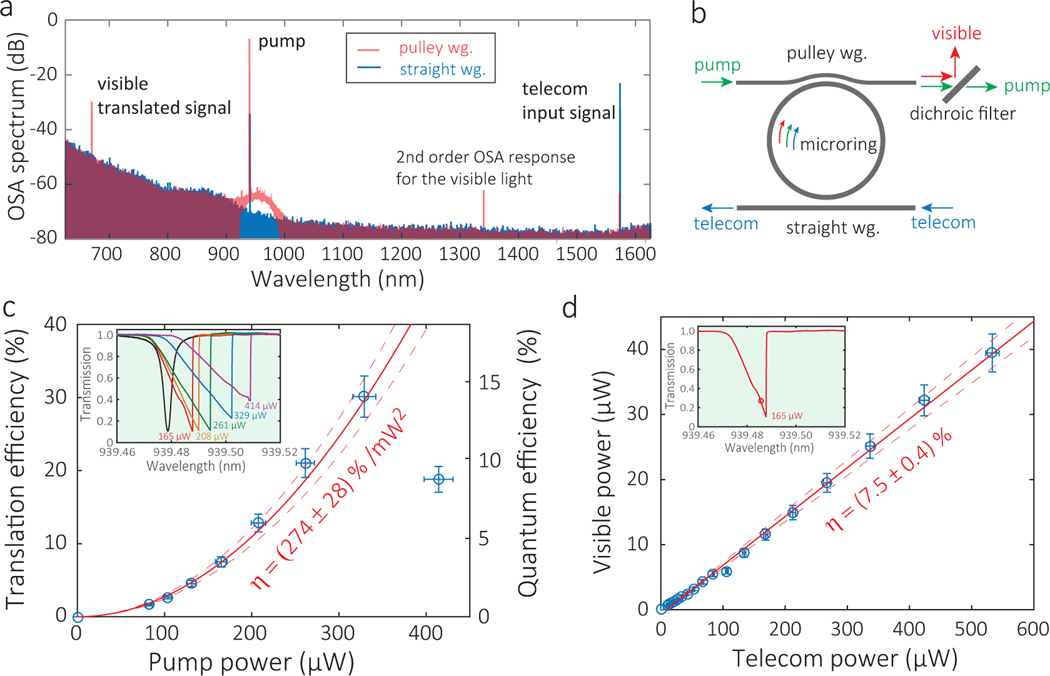
FIG. 4: Telecom-to-visible nanophotonic spectral translation.
a, Optical spectra recorded in the pulley (red) and straight (blue) waveguides for the spectral translation device. The telecom light at 1572.7 nm (blue) is transferred to a visible wavelength at 669.8 nm (red) through a pump at 939.5 nm, with no other translation channels or noise contribution observed. 0 dB is referenced to 1 mW (i.e., dBm). b, A dichroic filter is used to reject the pump light (> 80 dB) in order to calibrate the visible power accurately in pump-power dependent measurements. c, Translation efficiency (, left y-axis) and quantum efficiency (, right y-axis) versus pump power. A translation efficiency is achieved for (329 ± 13) μW pump power. The quadratic dependence on pump power is a signature of the degenerate four-wave mixing process. Solid and dashed red lines represent the quadratic fitting and its one standard deviation confidence range. Insets show the corresponding pump transmission traces. The pump detuning is brought close to the bottom of the transmission dip to maximize the translation efficiency. d, Output visible power as a function of input telecom power for a fixed pump power of (165 ± 7) μW, with a translation efficiency determined by a linear fit of . The pump detuning is kept constant as indicated by the open circle in the inset transmission trace. Solid and dashed red lines represent the linear fitting and its one standard deviation confidence range. Error bars in c-d are one standard deviation uncertainties originating from calibration of the on-chip power.

