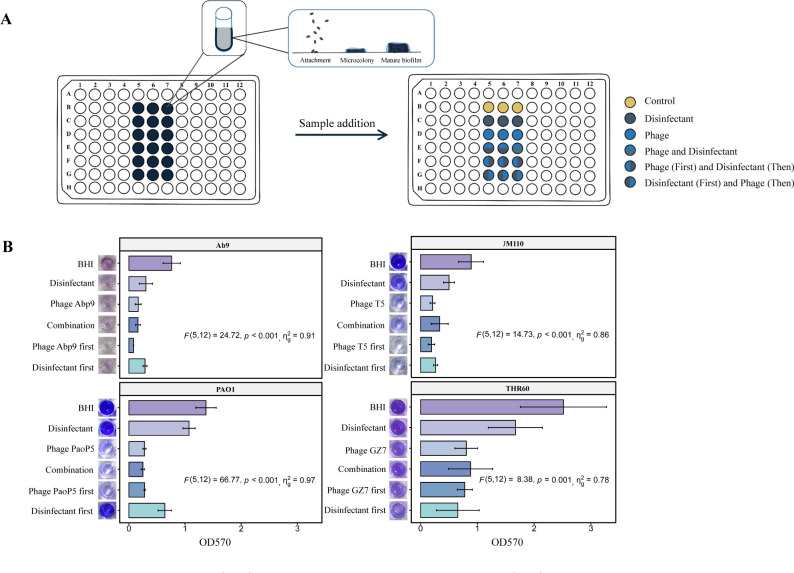
Fig 2.
(A) Schematic diagram of the biofilm removal experiment. Yellow represents brain heart infusion (BHI). Dark green represents sodium dichloroisocyanurate (0.05% wt/vol). Blue represents phages. Blue above and dark green below represent the simultaneous treatment of bacteria with phage and sodium dichloroisocyanurate, respectively (0.05% wt/vol). Blue on the left and dark green on the right indicate that the phages were applied first, and sodium dichloroisocyanurate (0.05% wt/vol) was used for treatment afterward. Dark green on the left and blue on the right indicate that sodium dichloroisocyanurate (0.05% wt/vol) was used for treatment first, and phages were applied afterward. (B) Results of biofilm clearance experiments. The data represent the mean of three biological replicates, the six graphs on the left of each group show the results of biofilm crystal violet staining, and the bar graph on the right represents the optical density at 570 nm (OD570) values. "Disinfectant" represents sodium dichloroisocyanurate (0.05% wt/vol); "Phage" represents Abp9, T5, PaoP5, or GZ7; "Combination" represents phages and sodium dichloroisocyanurate (0.05% wt/vol); "Phage first" represents the phage used first and then sodium dichloroisocyanurate (0.05% wt/vol); "Disinfectant first" represents sodium dichloroisocyanurate (0.05% wt/vol) used first and then phages. The data were presented as means ± SD. Statistical analysis was conducted using one-way ANOVA. The effect sizes (ηg2) demonstrated the relative magnitude of strain differences observed in each experiment. Inferential statistical comparison resulted in suggestive evidence (P < 0.05).

