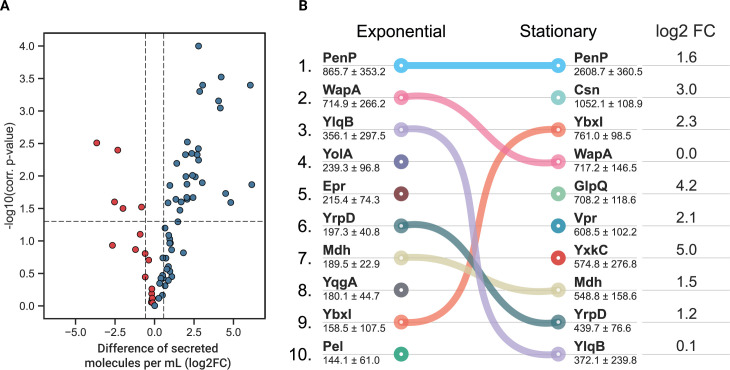
Fig 2.
(A) Difference of secreted molecules per milliliter for secreted proteins [log2 fold change (FC)] between exponential and stationary phases. Blue means higher abundance in the stationary phase; red means higher abundance in the exponential phase. (B) Dynamics of the top 10 major components of the exoproteome with their concentrations indicated in femtomoles per milliliter (average ± SD). Connecting lines visualize the change in the ranking position if the protein is still among the 10 most secreted proteins. The change in protein abundance between both growth phases is summarized in the log2FC column, in which fold change is calculated as the difference of log-transformed secreted proteins in femtomole per milliliter in the stationary compared to the exponential phase for the top 10 most abundant proteins in stationary phase.

