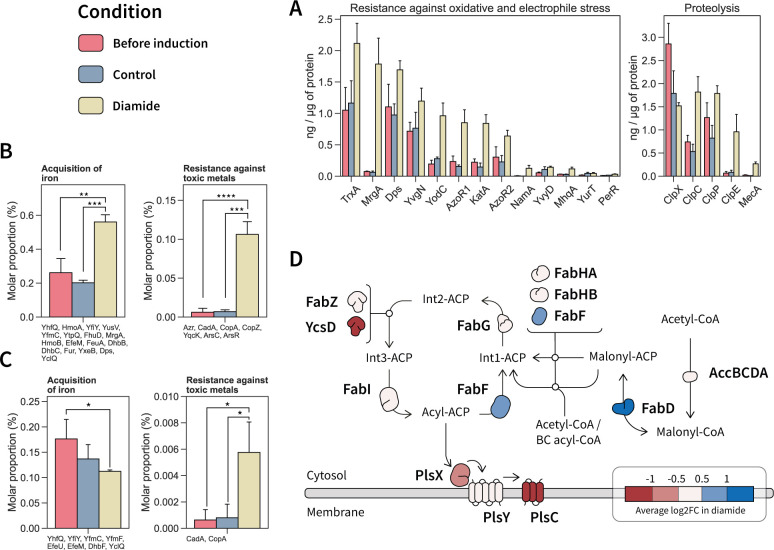
Fig 4.
Main quantified changes in the cytosol and membrane proteome in response to diamide stress. (A) Quantified cytosolic proteins involved in the oxidative stress response and protein homeostasis showing significant changes in their abundance (ng/µg of protein) under diamide stress. (B) Protein functions of which the molar proportion was changed under diamide stress in the cytosolic fraction. Quantified proteins within the functional category are listed below each plot. (C) Protein functions in the membrane of which the molar proportion was changed under diamide stress. Quantified proteins within the functional category are listed below each plot. Significance levels are expressed as * (adj. P ≤ 0.05), ** (adj. P ≤ 0.01), *** (adj. P ≤ 0.001) and **** (adj. P ≤ 0.0001). (D) Fatty acid biosynthetic pathway with quantified changes in protein abundance.

