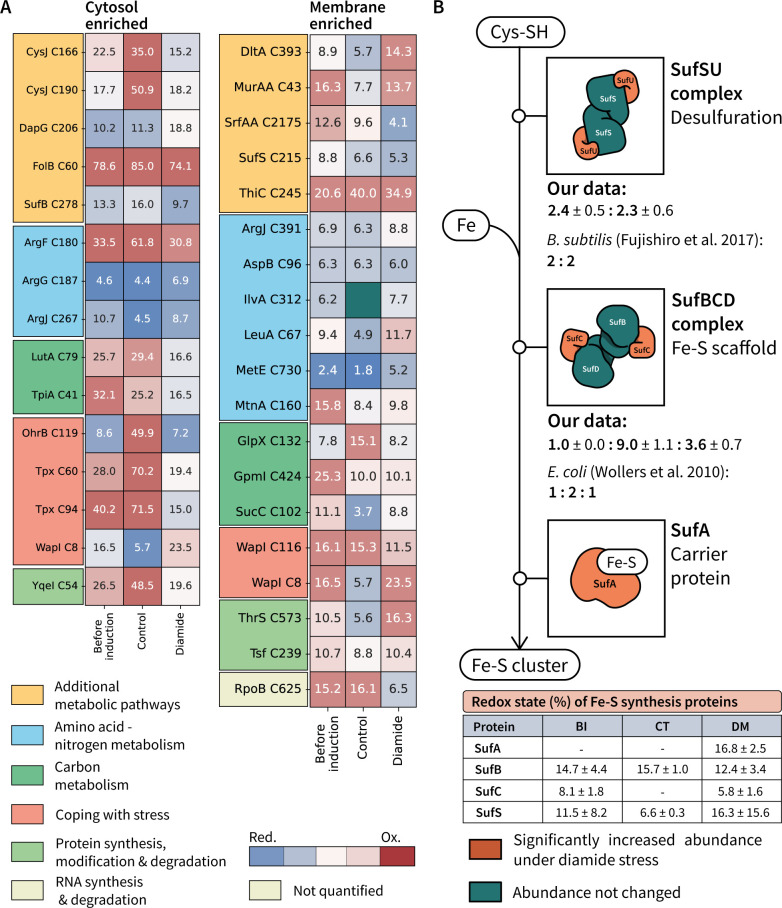
Fig 5.
(A) Significantly changed (adjusted P value of <0.05) cysteines in the cellular fractions obtained from cytosol and membrane-enriched samples. In-box annotation (percent oxidized) and color reflect the average redox state for the quantified cysteine. (B) Fe-S cluster synthesis pathway describing protein complex stoichiometries under disulfide stress. In the table, percentage of oxidations (average ± SD) is described for each protein identified in the Fe-S cluster synthesis pathway for the samples taken before induction (BI), as well as 1 h after addition of diamide (DM) or medium [control (CT)].

