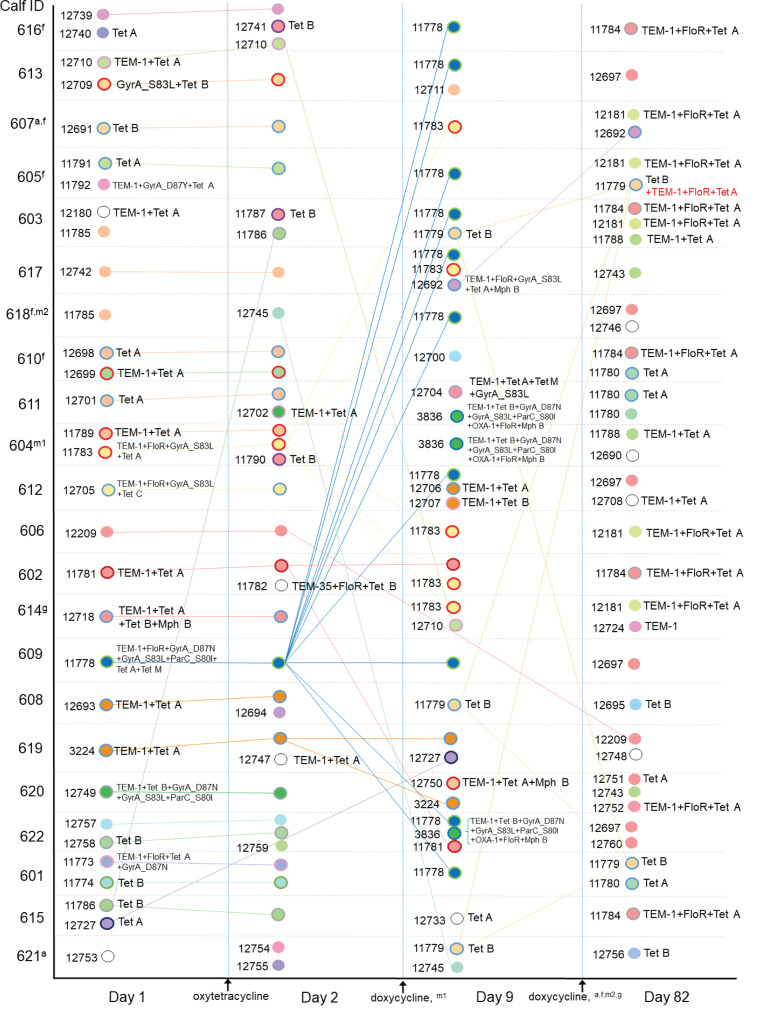
Fig 2.
Distribution among calves and dynamics over time of Escherichia coli isolates, with respective core genome MLST CT, sequence type (inner circle color), and determinants of resistance to antimicrobial drugs used during the study (outer circle color). For instance, on D1, calves 606, 602, and 614 carried isolates of different CT belonging to ST58 (same inner circle color) and harbored different resistance determinants’ combinations (different outer circle colors) or lack thereof. In cases of within-sample isolates with identical CT and shown resistance determinants (clonal or not), a single one of the strains is shown for improved clarity. Resistance determinants written in red represent an addition to the temporally previously observed combination of CT and resistance determinants. Connecting lines between isolates at different time points indicate clonal isolates based on CT. Superscripts indicate which calves and at which time interval between samplings received individual antimicrobial treatments: amoxicillin (a), florfenicol (f), gamithromycin (g), and marbofloxacin (m; first and second treatment incidence).

