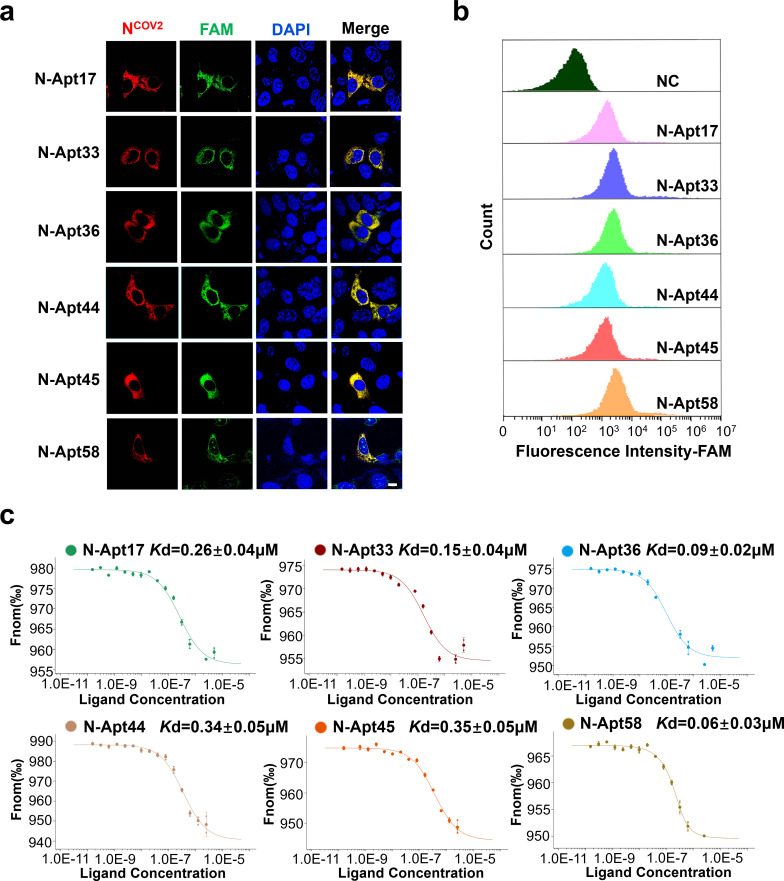
Fig 2.
Affinity and specificity of six N-aptamers binding to N protein. (a) Confocal microscopy images showing the colocalization of N protein and FAM-labeled N-aptamers in HEK293T cells overexpressing N protein. Scale bars: 10 µm. (b) Flow cytometry analysis of FAM-labeled N-aptamers and a negative control (NC) (random sequence) co-incubated with N protein immobilized on magnetic beads. (c) Measurement of the Kd (dissociation constant) value between N-aptamers and N protein using MST-based assay.

