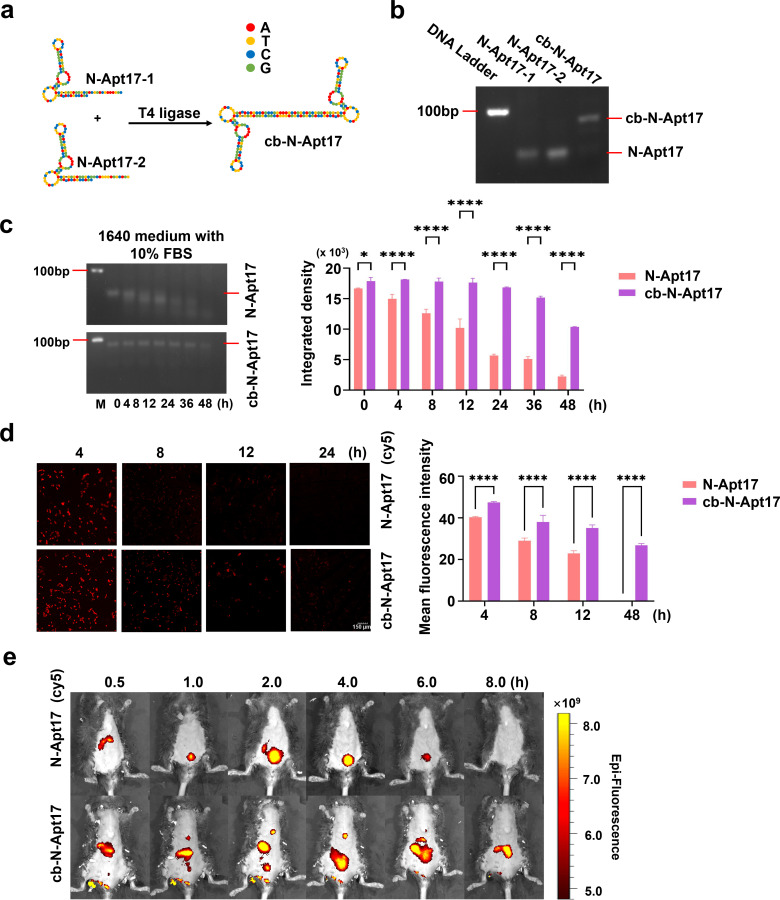
Fig 4.
Stability analysis of N-Apt17 and cb-N-Apt17. (a) Schematic diagram illustrating the construction process and structure of cb-N-Apt17. (b) Agarose electrophoresis analysis of N-Apt17 and cb-N-Apt17. (c) Determination of the stability of N-Apt17 and cb-N-Apt17 by agarose electrophoresis after incubation for different periods in 1640 medium supplemented with 10% FBS (left). Quantification of band intensity for N-Apt17 and cb-N-Apt17 using Image J software and calculation using GraphPad software (right). M, DNA marker. (d) Observation of intracellular degradation rate of N-Apt17-cy5 and cb-N-Apt17-cy5 in HEK293T cells using fluorescence microscopy at different time points (left). Quantification of fluorescence signaling with Image J software and calculation using GraphPad software (right). (e) In vivo detection of the signal of N-Apt17-cy5 and cb-N-Apt17-cy5 in mice after intravenous injection via tail vein, assessed by in vivo bioluminescence imaging at different time points.

