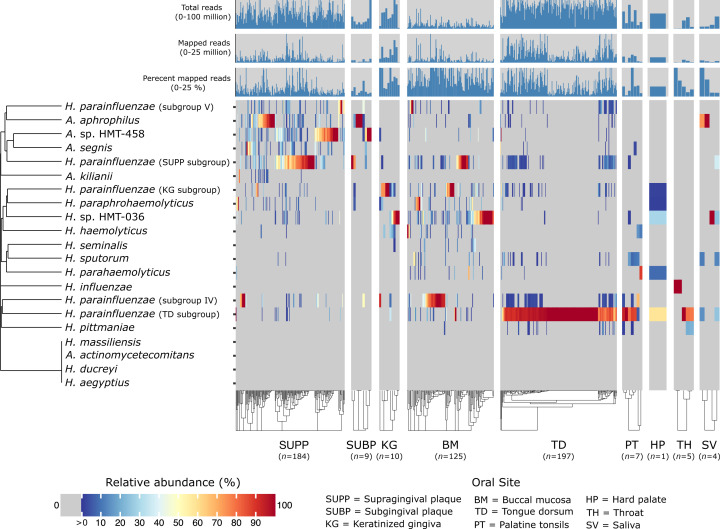
Fig 4.
Heatmap shows the relative abundance of Haemophilus and Aggregatibacter species concerning the set of reference genomes across nine major oral sites: supragingival plaque (SUPP), subgingival plaque (SUBP), keratinized gingiva (KG), tongue dorsum (TD), palatine tonsils (PT), throat (TH), saliva (SV), hard palate (HP), and buccal mucosa (BM). Relative abundance for each species represents the sum of relative abundances of each reference genome from that species, calculated from the mean depth of coverage across nucleotide positions in the 2nd and 3rd quartiles (the Q2Q3 interquartile range) after nucleotides were ranked by their depth of coverage and then divided by the sum of mean coverages of all genomes within a metagenomic sample. The rows and columns correspond to individual species and Human Microbiome Project metagenomic samples, respectively. Only metagenomes in which at least one reference genome was detected (i.e., at least 50% of its nucleotides have at least 1X coverage) were included. The number of samples for each oral site at which a species was detected is listed in the figure. For clearer visualization, we inflated the width of oral sites with small sample sizes. Species (y-axis) and samples within oral sites (x-axis) are hierarchically clustered based on Bray–Curtis distances.

