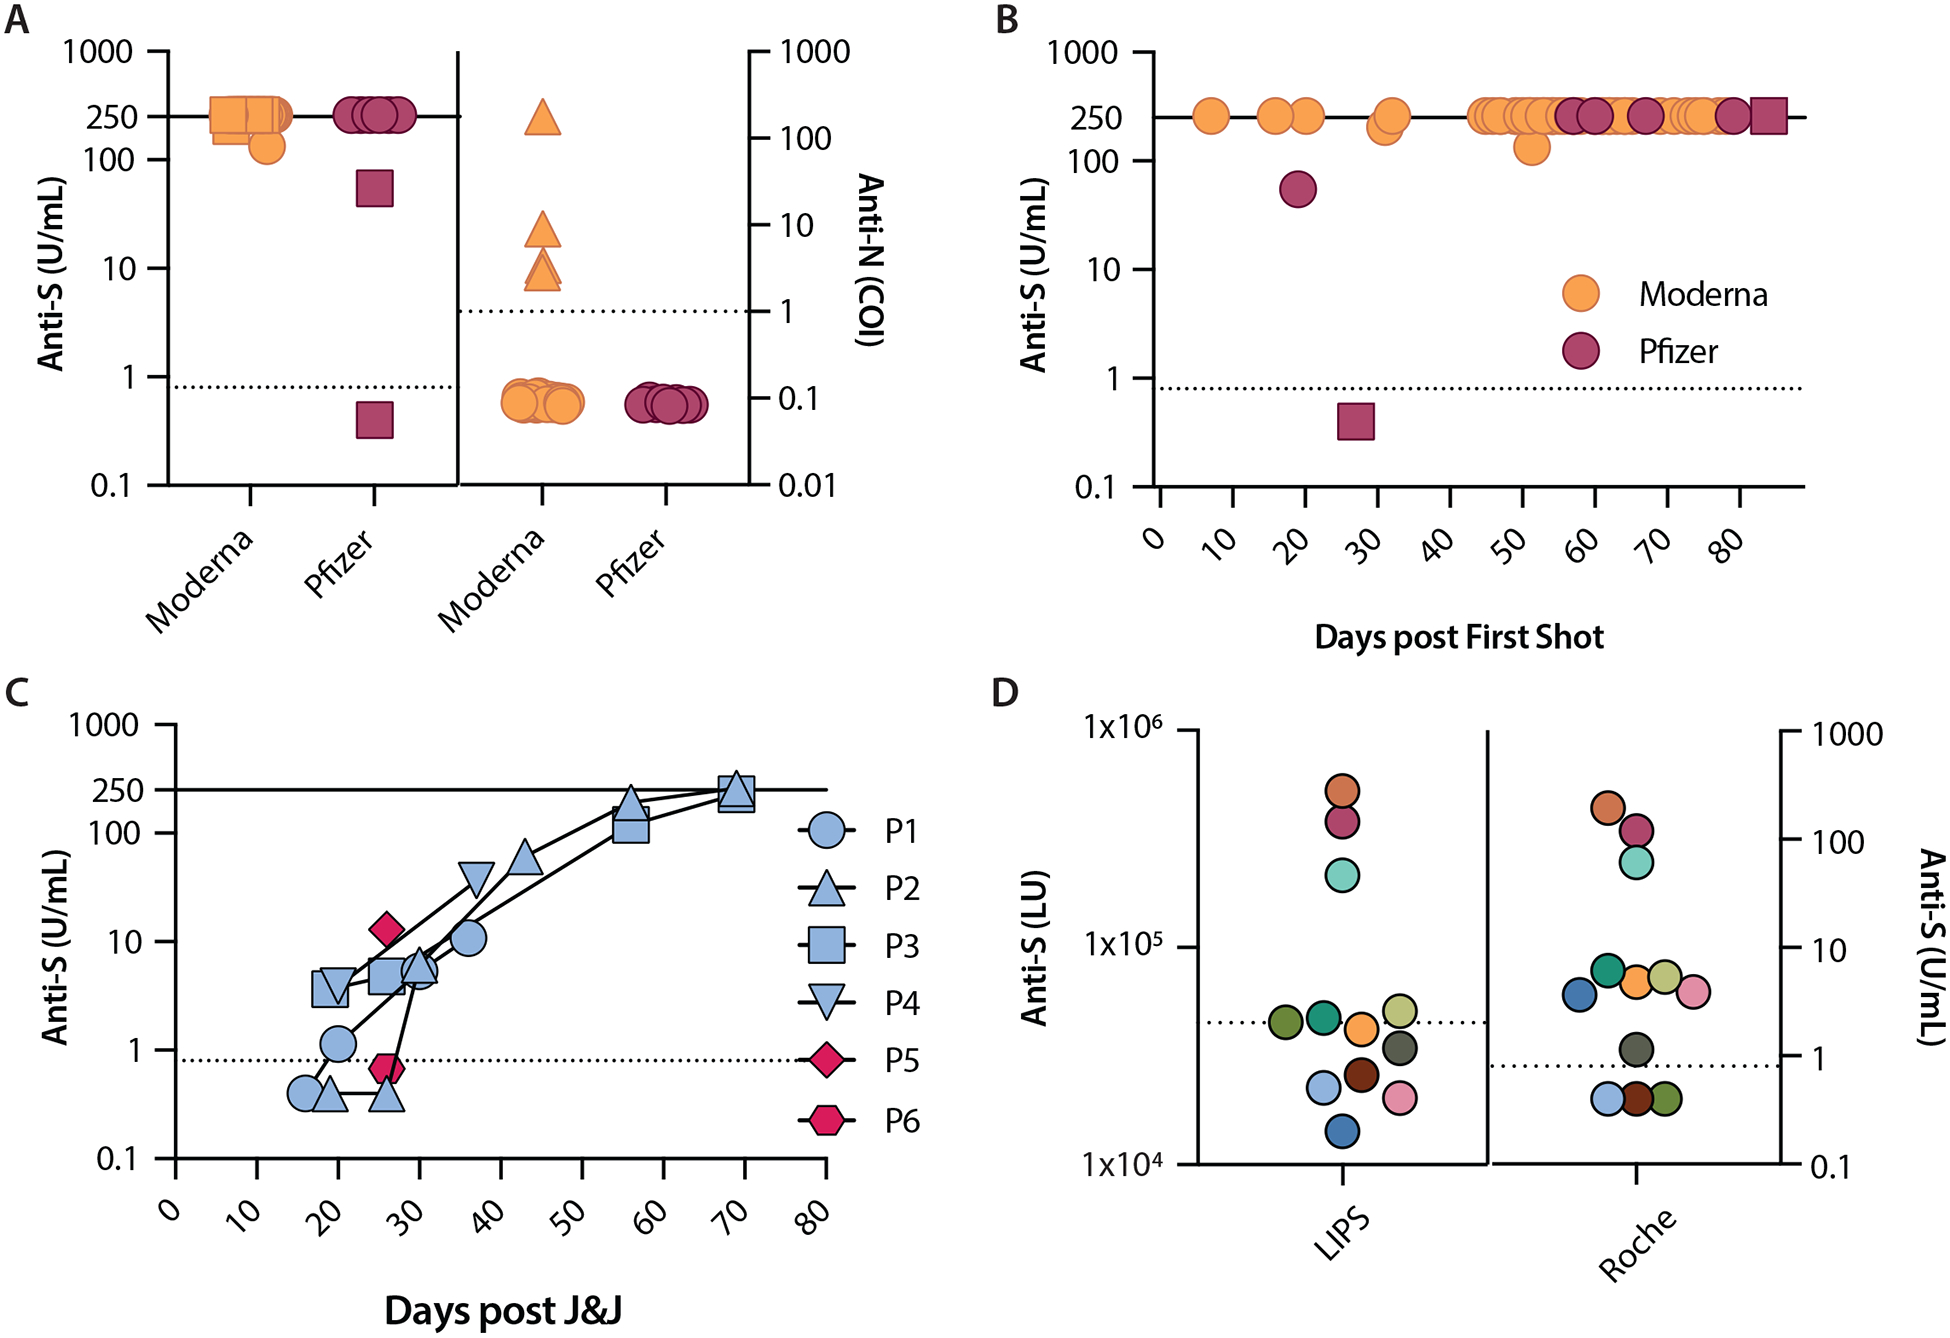
Figure 1.

Severe acute respiratory syndrome coronavirus 2 (SARS-CoV-2) antibody levels following Moderna, Pfizer, or J&J vaccination. A. Anti-S and anti-N levels after Moderna and Pfizer vaccines. Squares represent specimens collected after a single shot (made distinct for anti-S only). Triangles represent specimens from participants with a history of SARS-CoV-2 infection (made distinct for anti-N only). B. Anti-S levels over days following first dose of Moderna and Pfizer. Earliest time point is at 7 days (Moderna) and the latest time point is at 84 days (Pfizer). Squares represent two specimens from the same Pfizer participant. C. Anti-S levels in specimens from the six J&J participants were measured once (P5 and P6) and over time (P1 to P4). D. Anti-S levels 12 specimens from J&J participants. Each color represents the same specimen tested with both LIPS and Roche assays. All data are plotted on a logarithmic scale. Anti-S levels are reported in U/mL (Roche) and LU (LIPS); anti-N levels are reported as a cutoff index (COI; signal sample/cutoff). Values ≥250 U/mL are assigned as 260 U/mL for easier visualization. Dashed lines represent cutoff thresholds at 0.8 U/mL (Roche anti-S), 1.0 COI (Roche anti-N), and 45000 LU (LIPS anti-S). Solid lines represent the upper limit of measurement for Roche anti-S assay (250 U/mL). COI: cutoff index; LIPS: luciferase immunoprecipitation system; LU: light units; P: participant.
