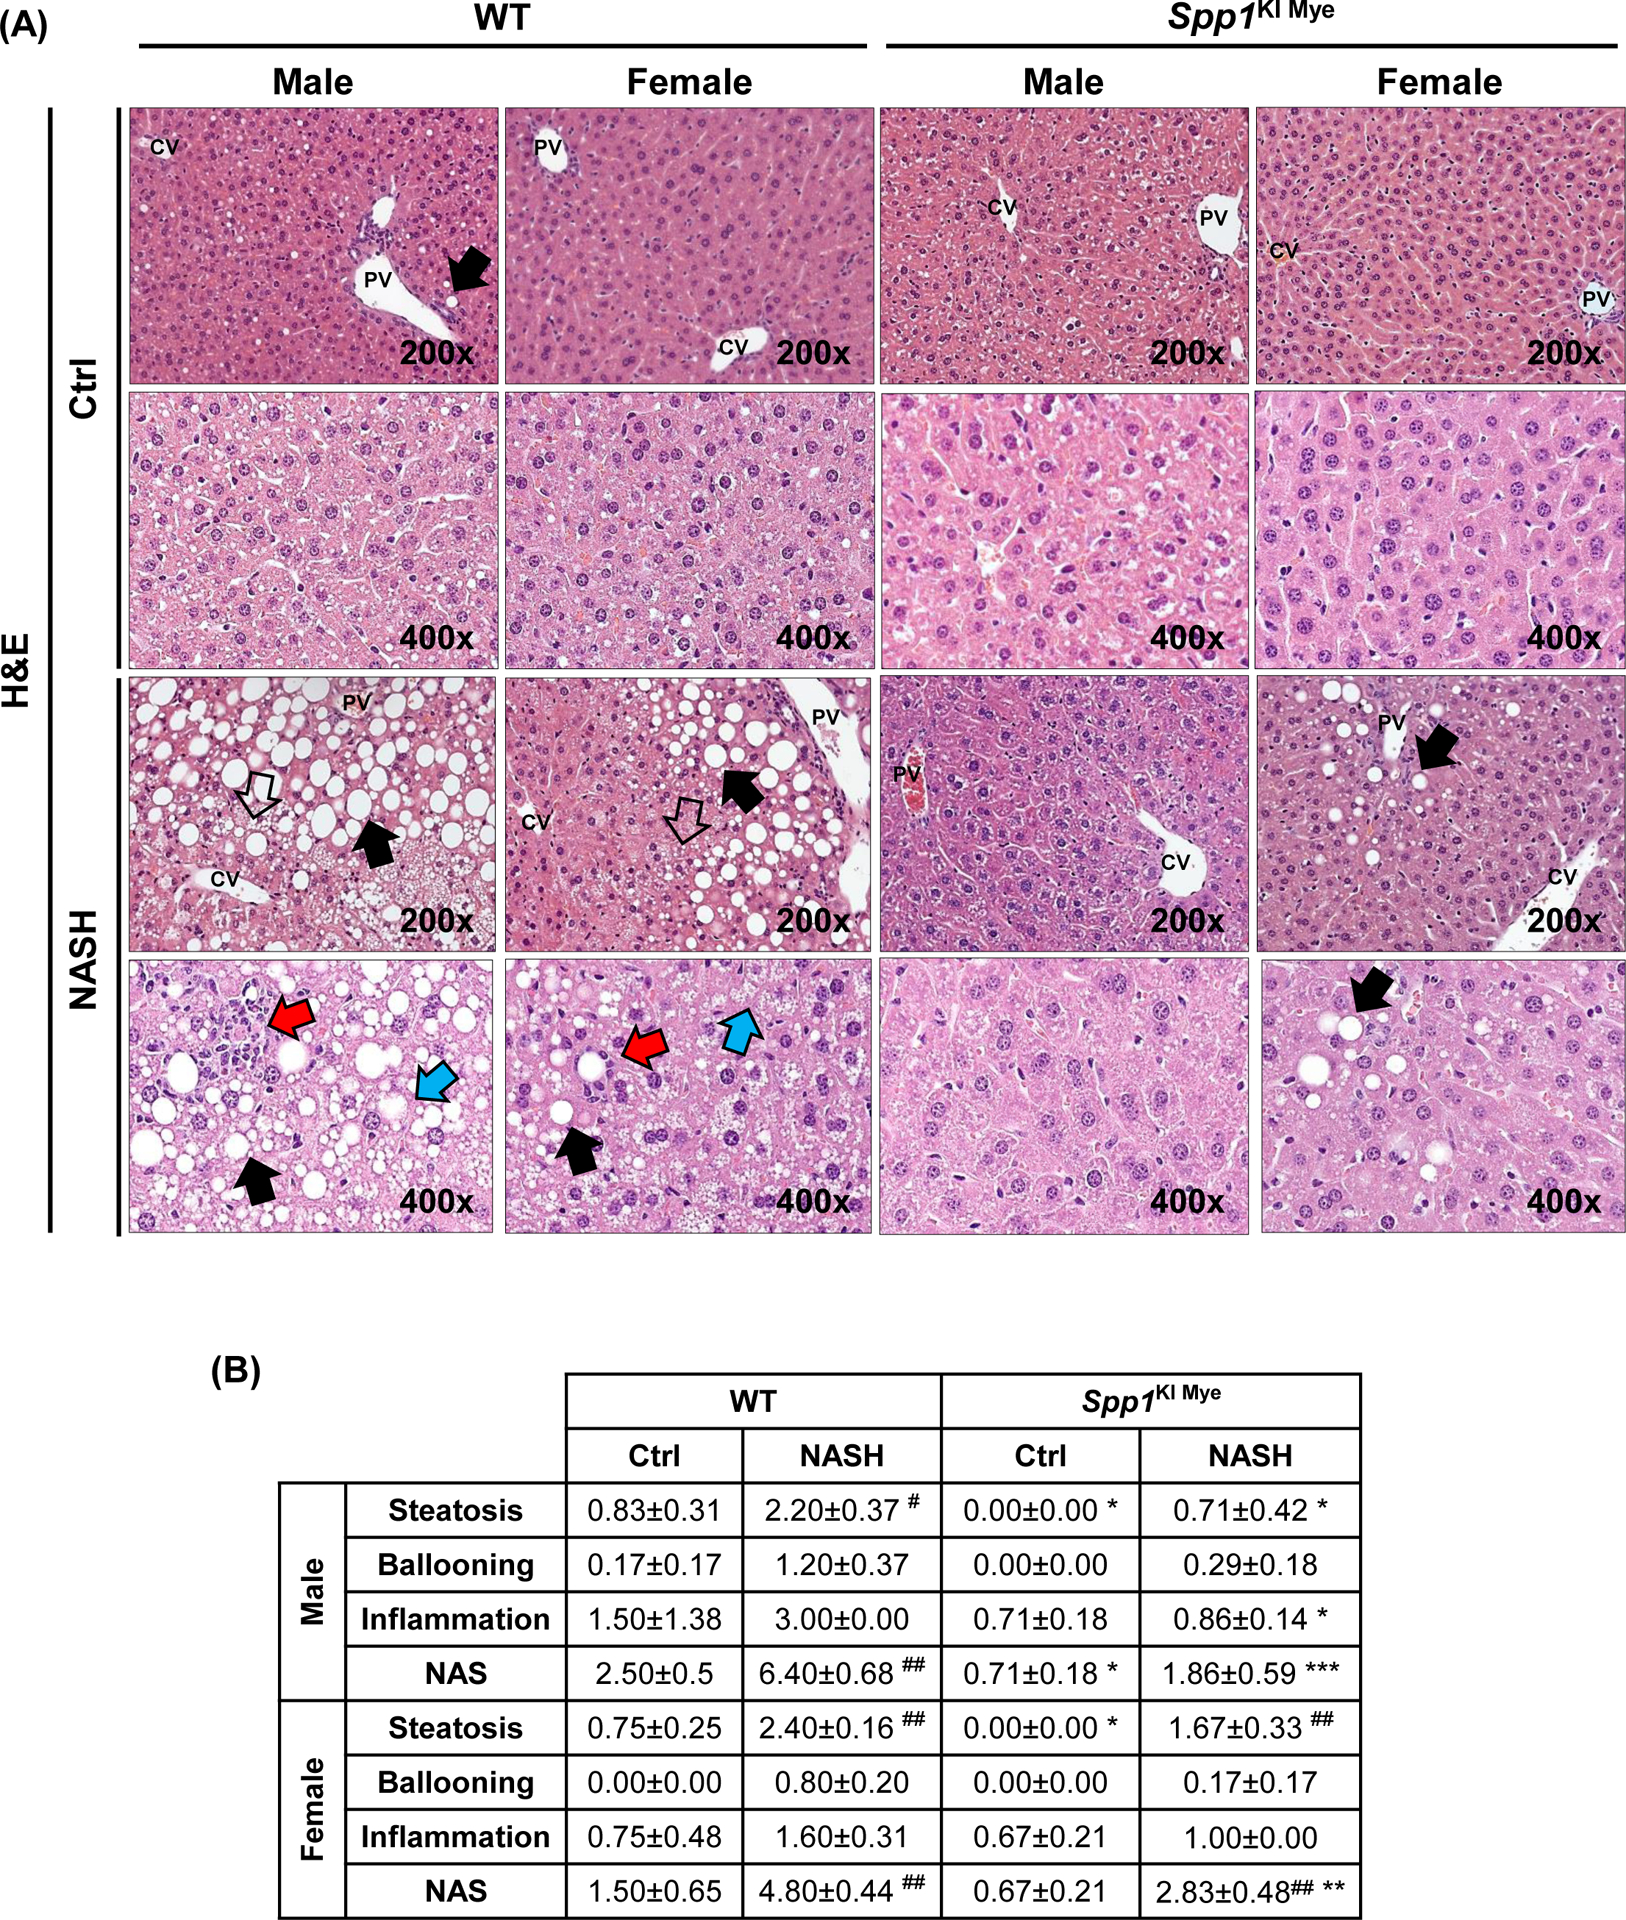
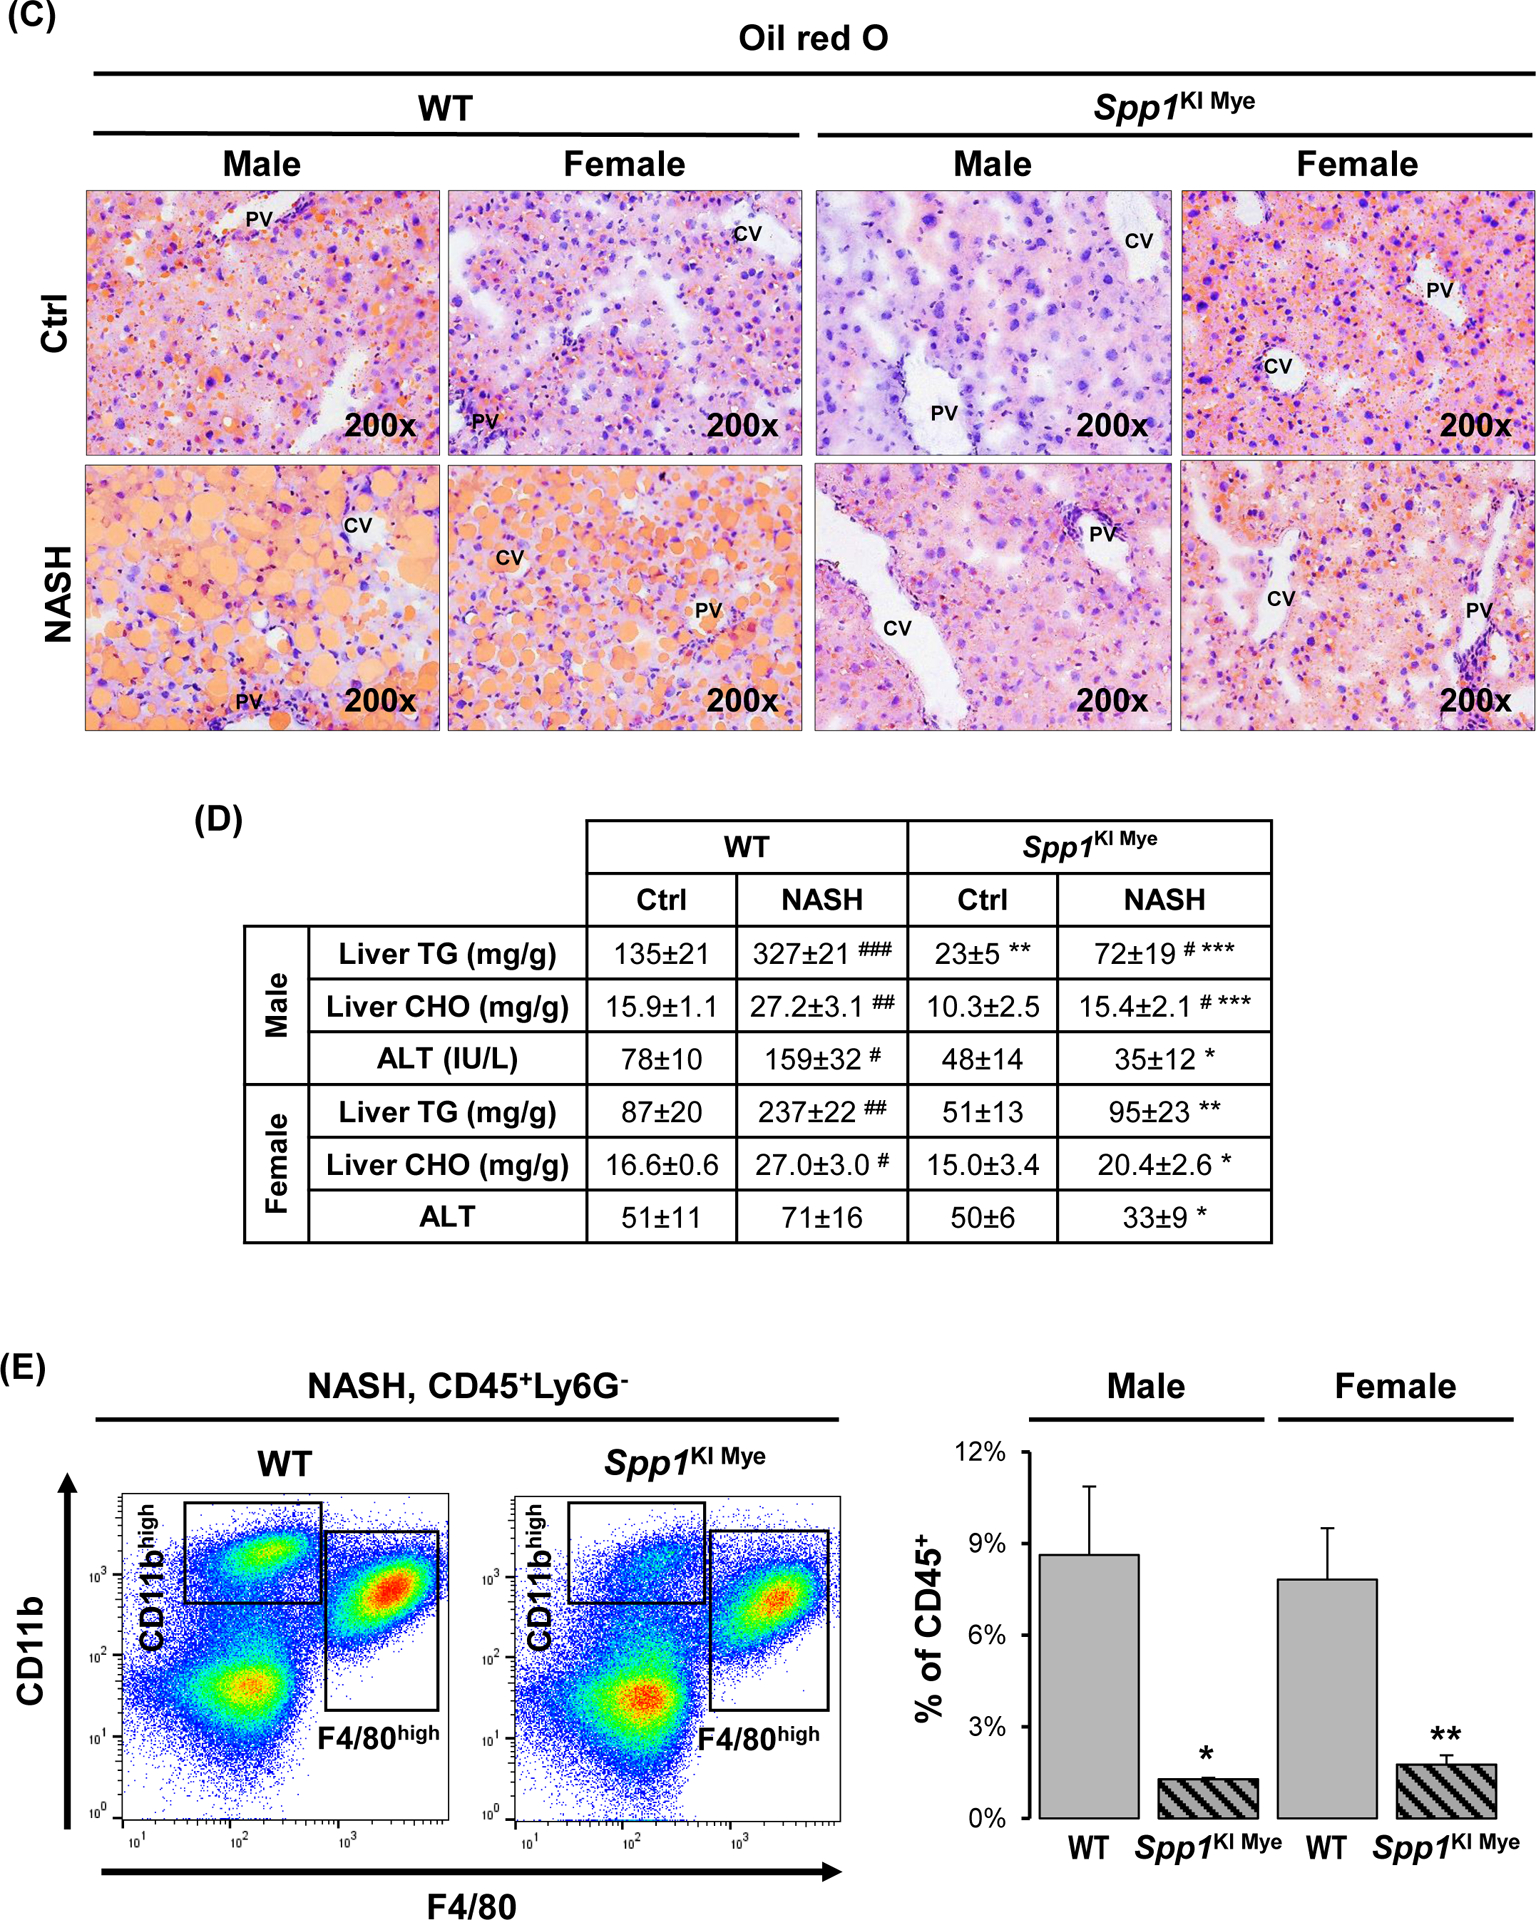
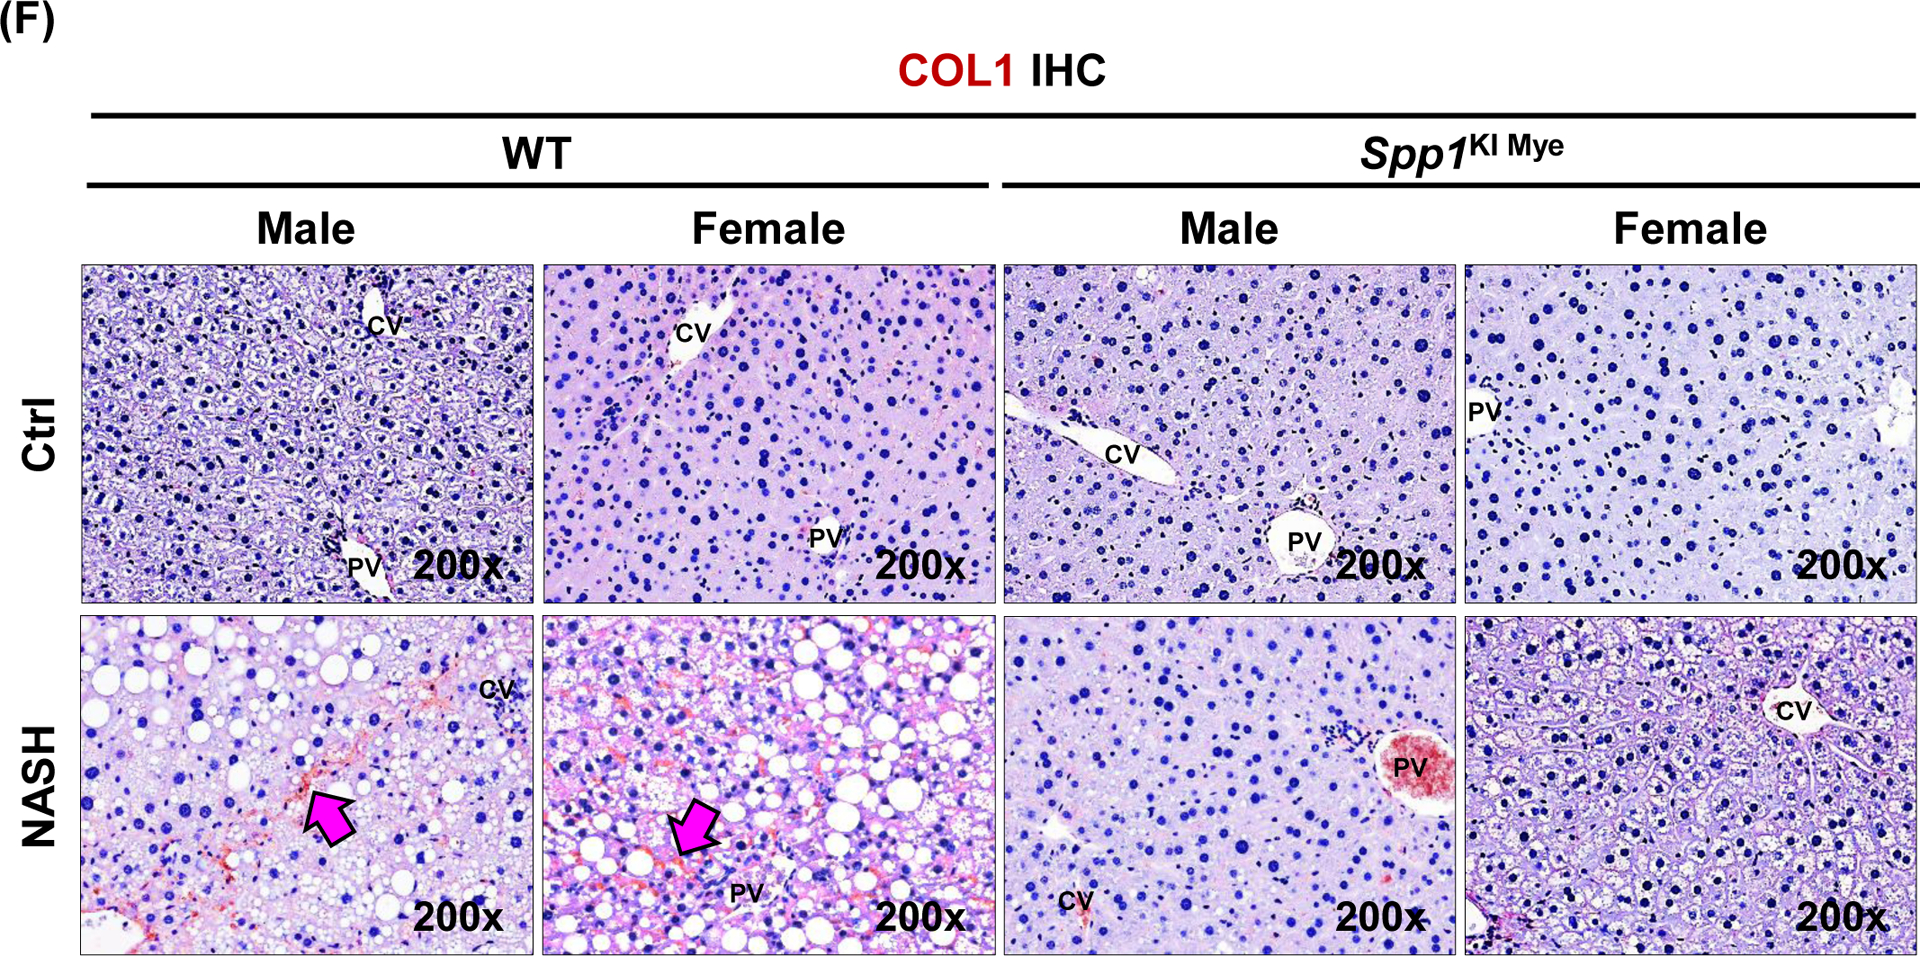
Figure 2. Spp1KI Mye mice are protected from NASH.


Spp1KI Mye and WT mice were fed for 6 months with control or NASH-inducing diet. (A) H&E staining of liver (black arrows: macrovesicular steatosis; black open arrows: microvesicular steatosis; red arrows: inflammatory foci; blue arrows: hepatocyte ballooning degeneration). (B) Individual scores and NAS. (C) Oil red O staining of liver. (D) Liver TGs and CHO normalized by protein, and serum ALT activity. (E) Flow cytometry analysis of immune cells based on CD11b and F4/80 (left) and quantification of infiltrating MoMFs (n=3/genotype) (right). (F) IHC for COL1 (pink arrows: collagen fibrils). Results are expressed as mean ± SEM; n≥6/group. #p<0.05, ##p<0.01 and ###p<0.001 vs. control with same genotype; *p<0.05, **p<0.01 and ***p<0.001 vs. WT with same diet.
