Figure 3. Increase in urea cycle and upregulation of Arg2 correlate with the protective effect of Spp1KI Mye mice.
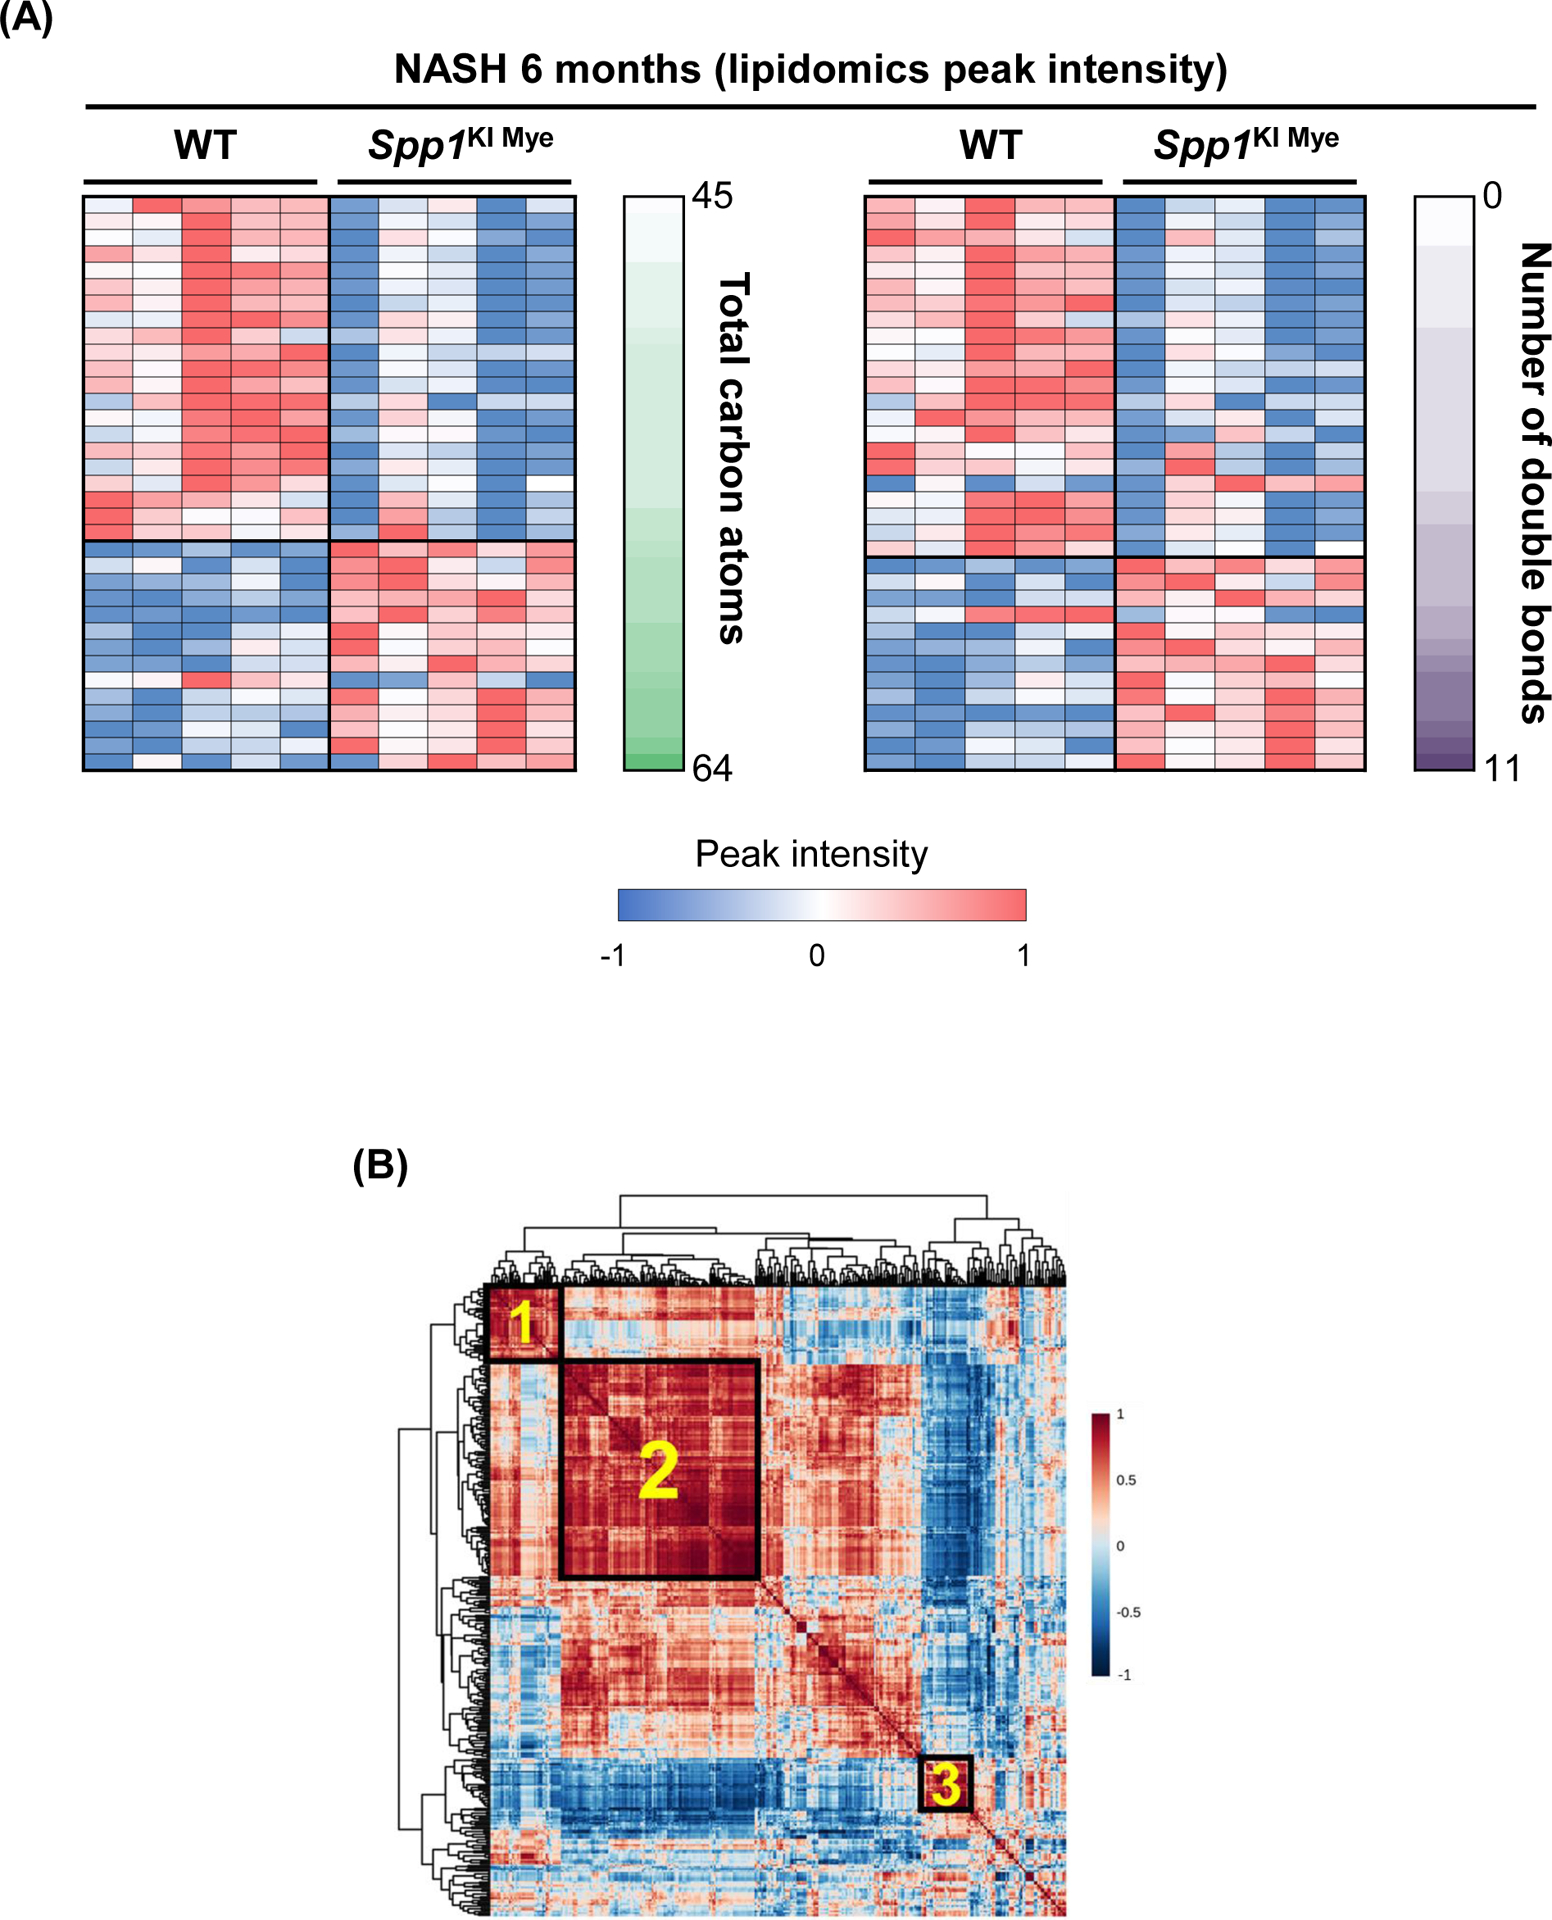
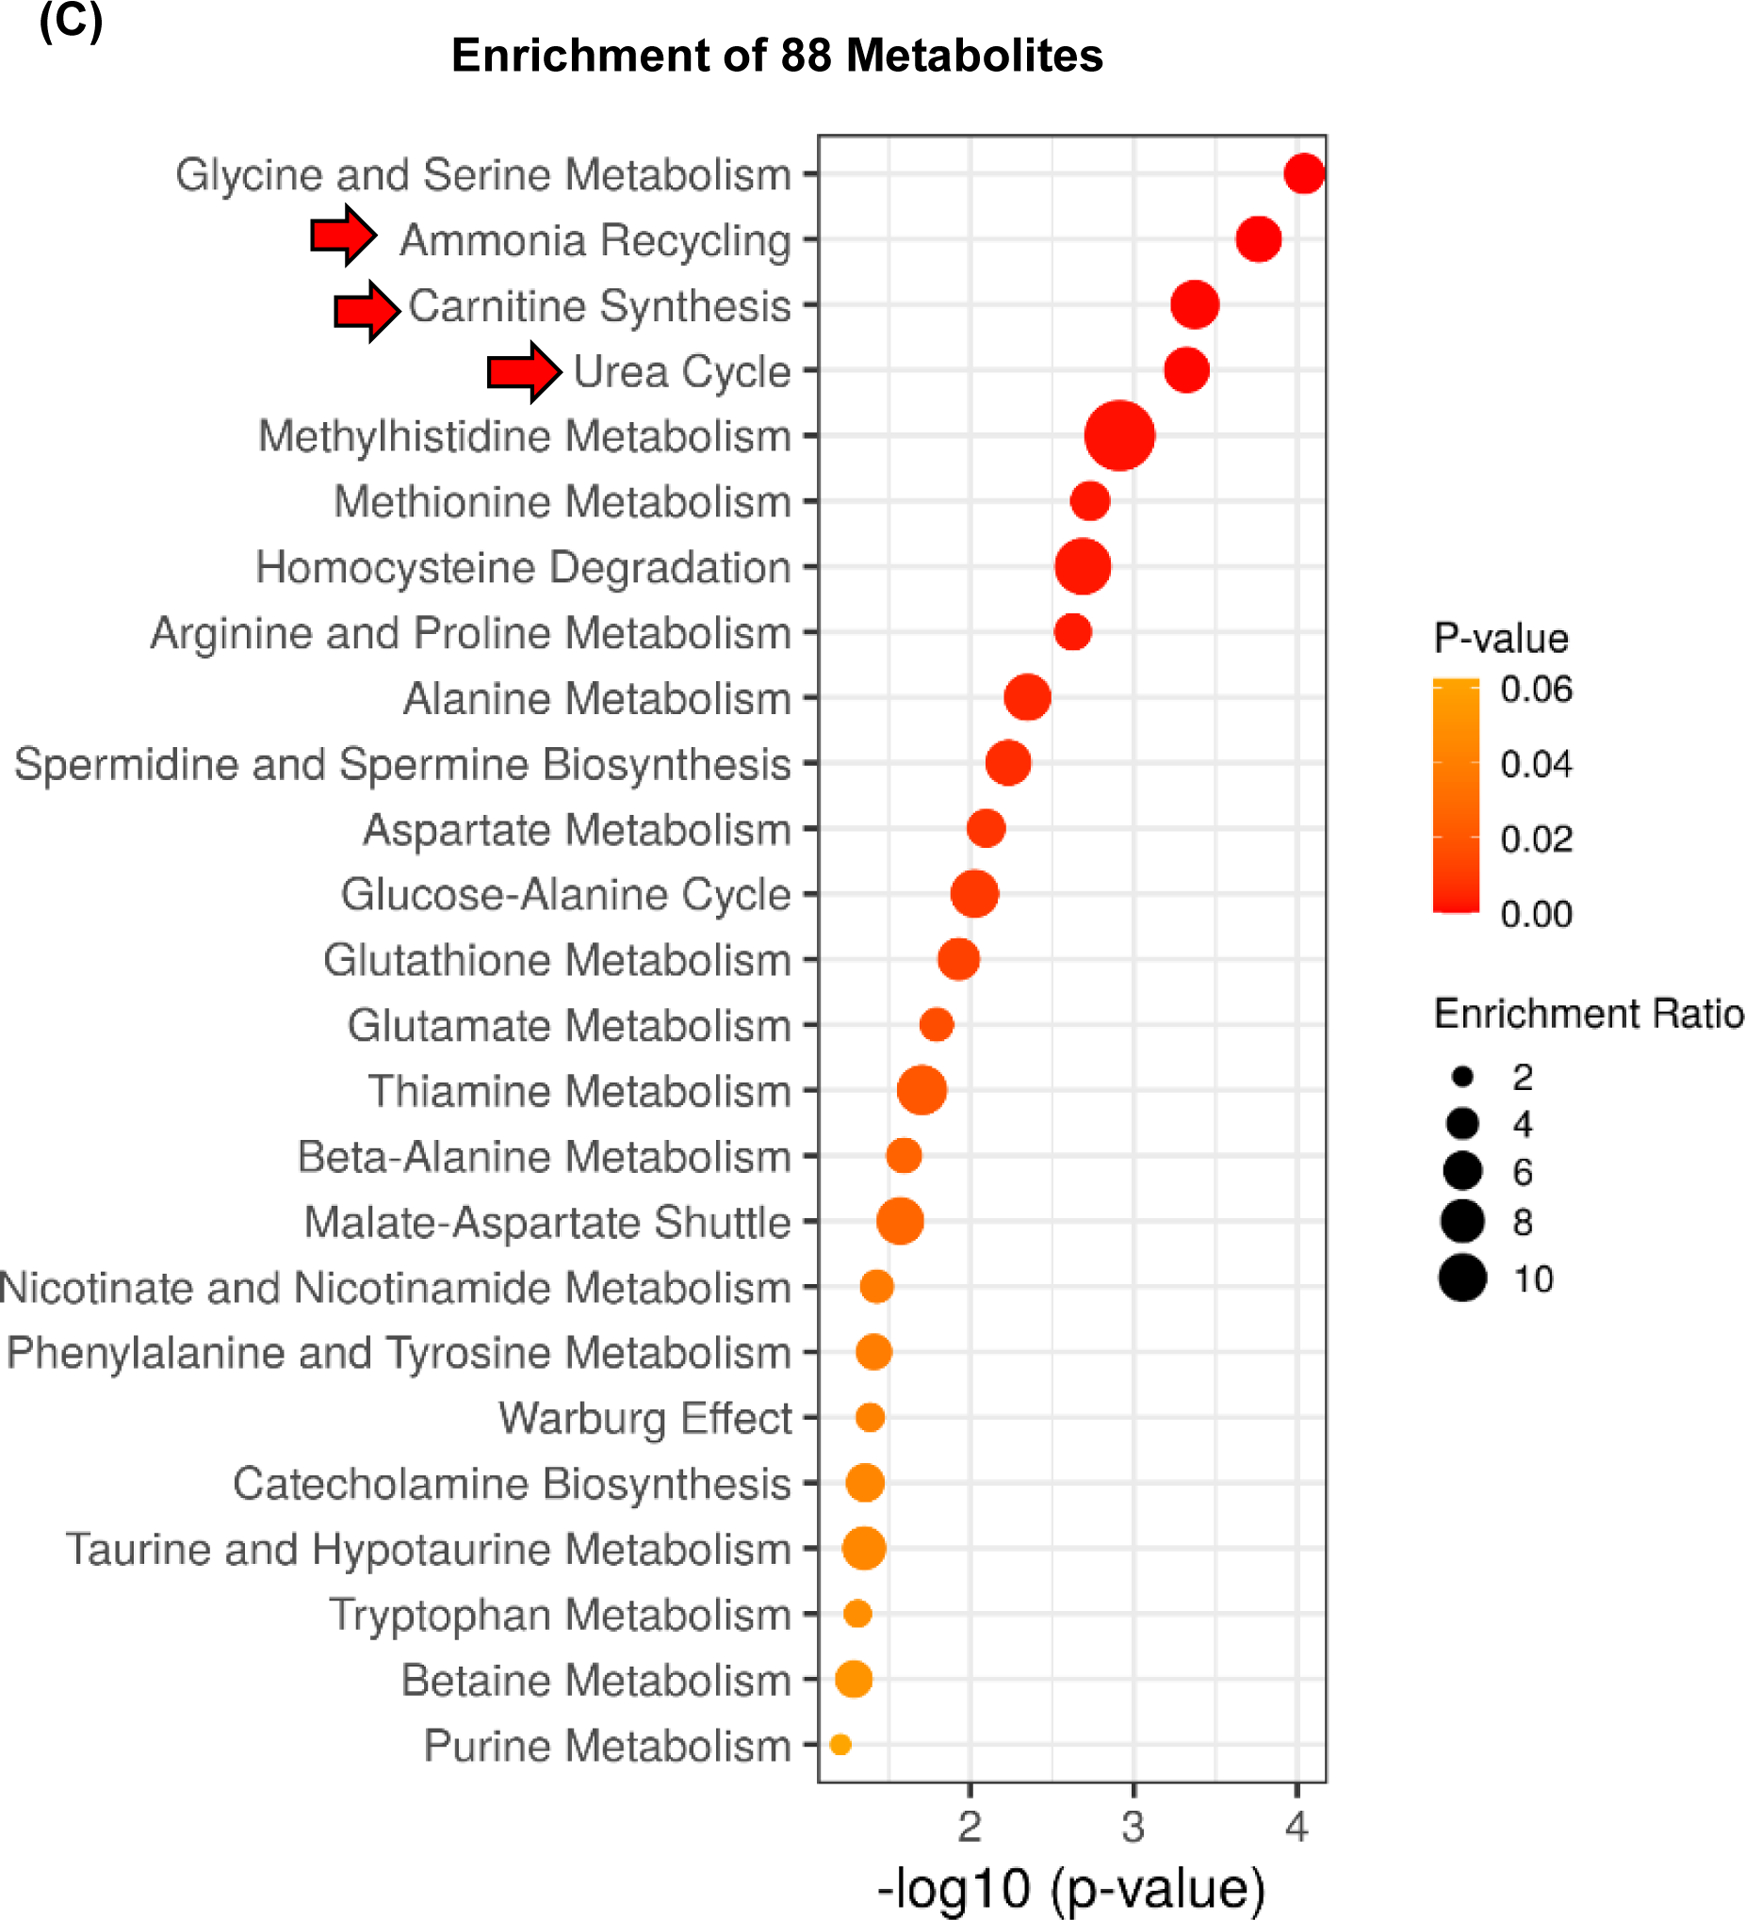
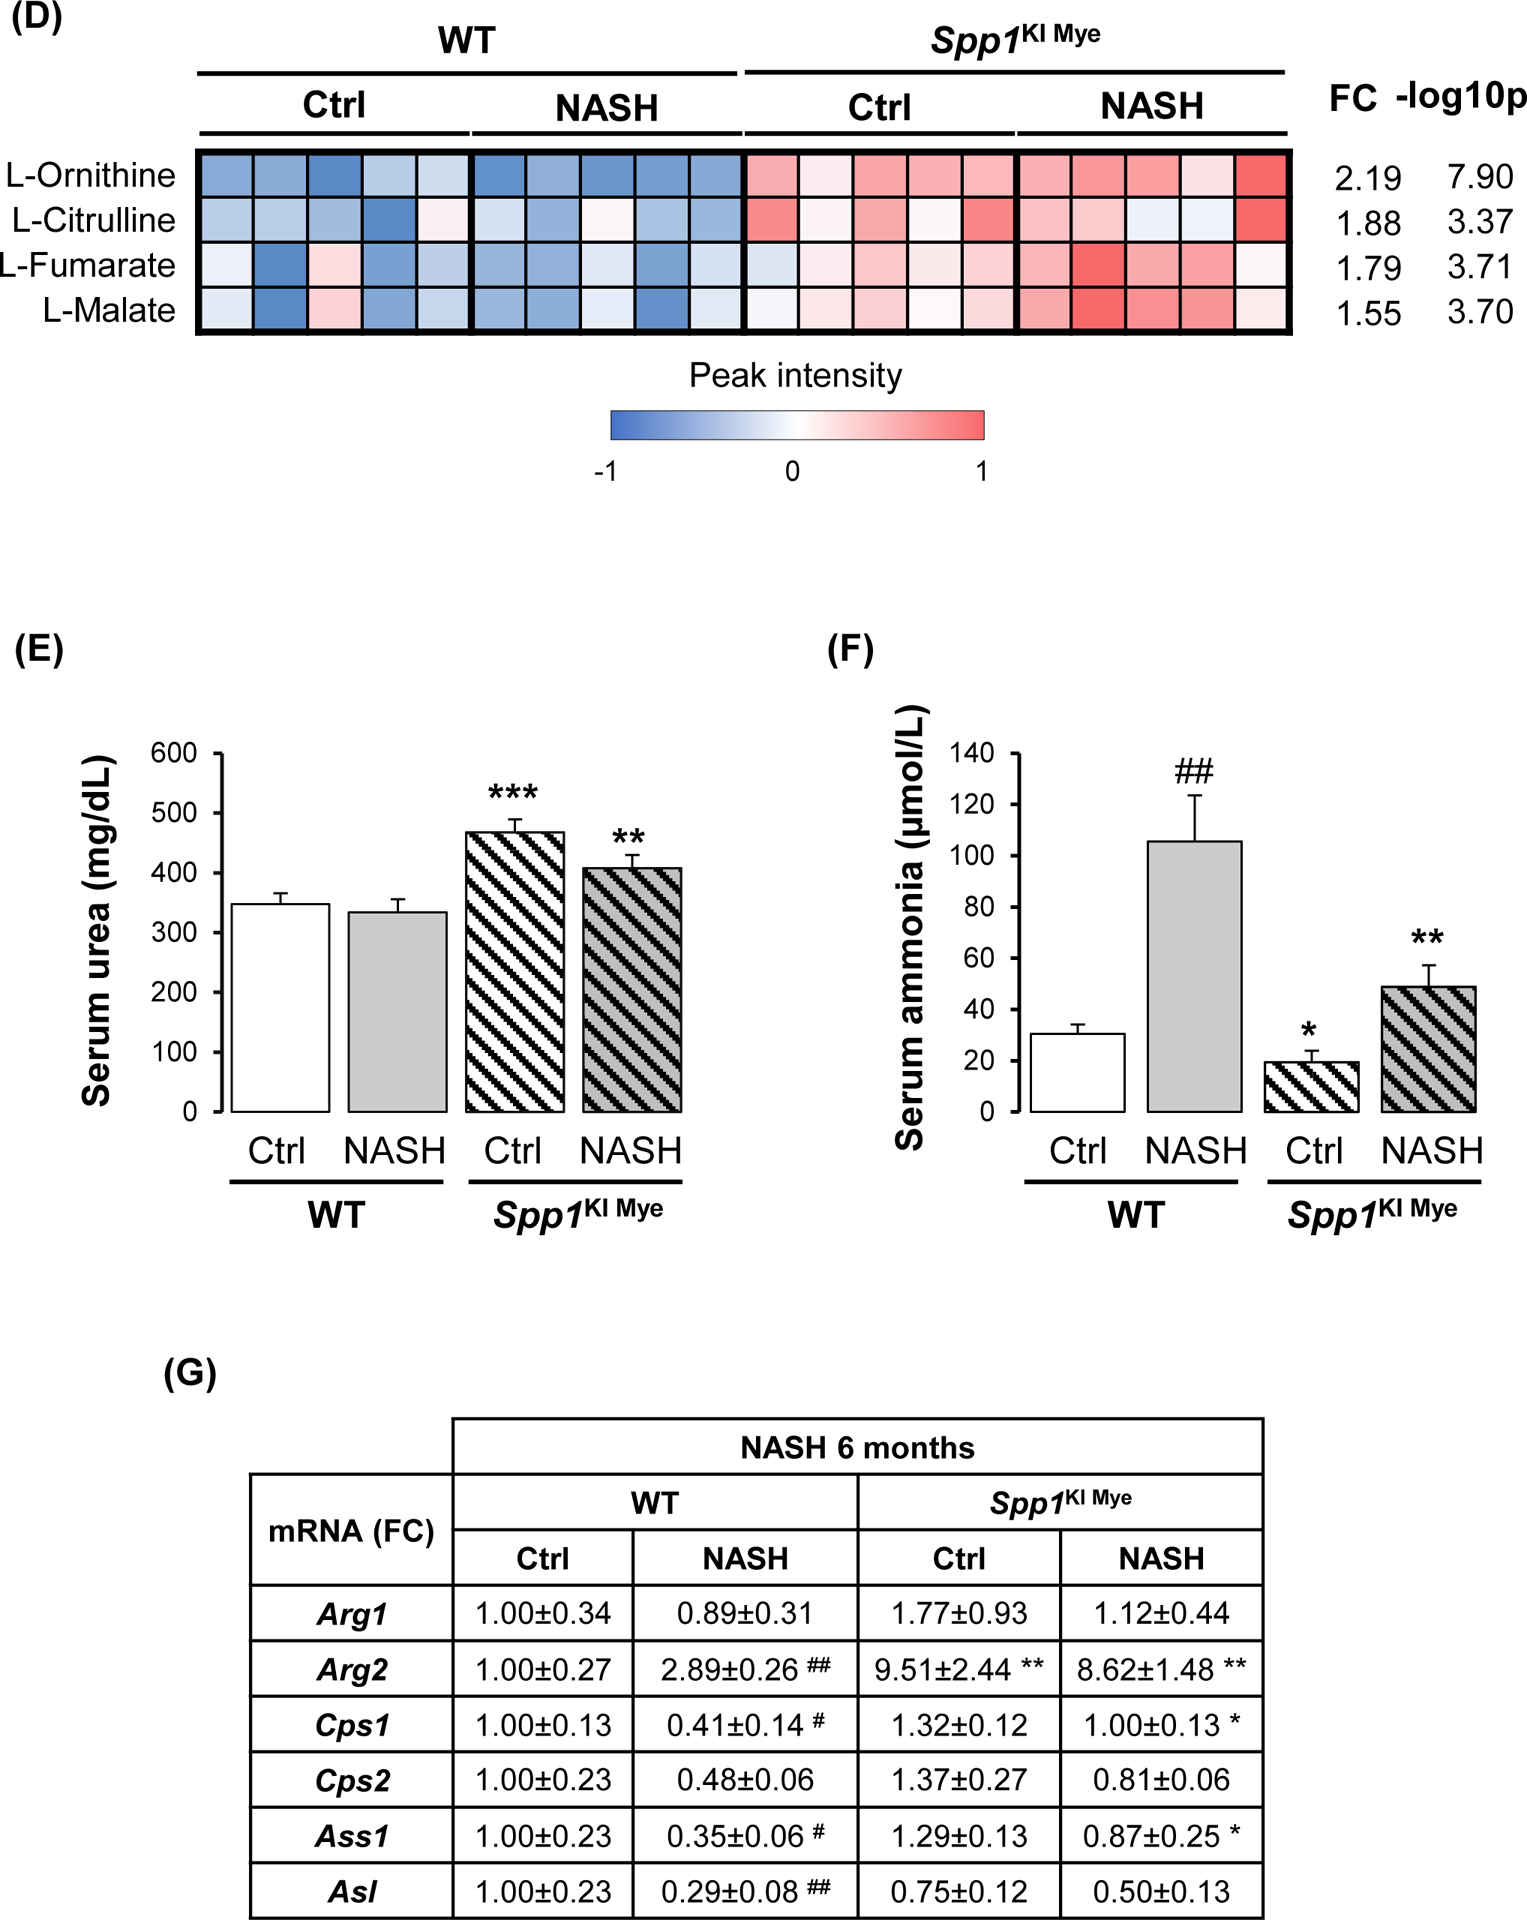
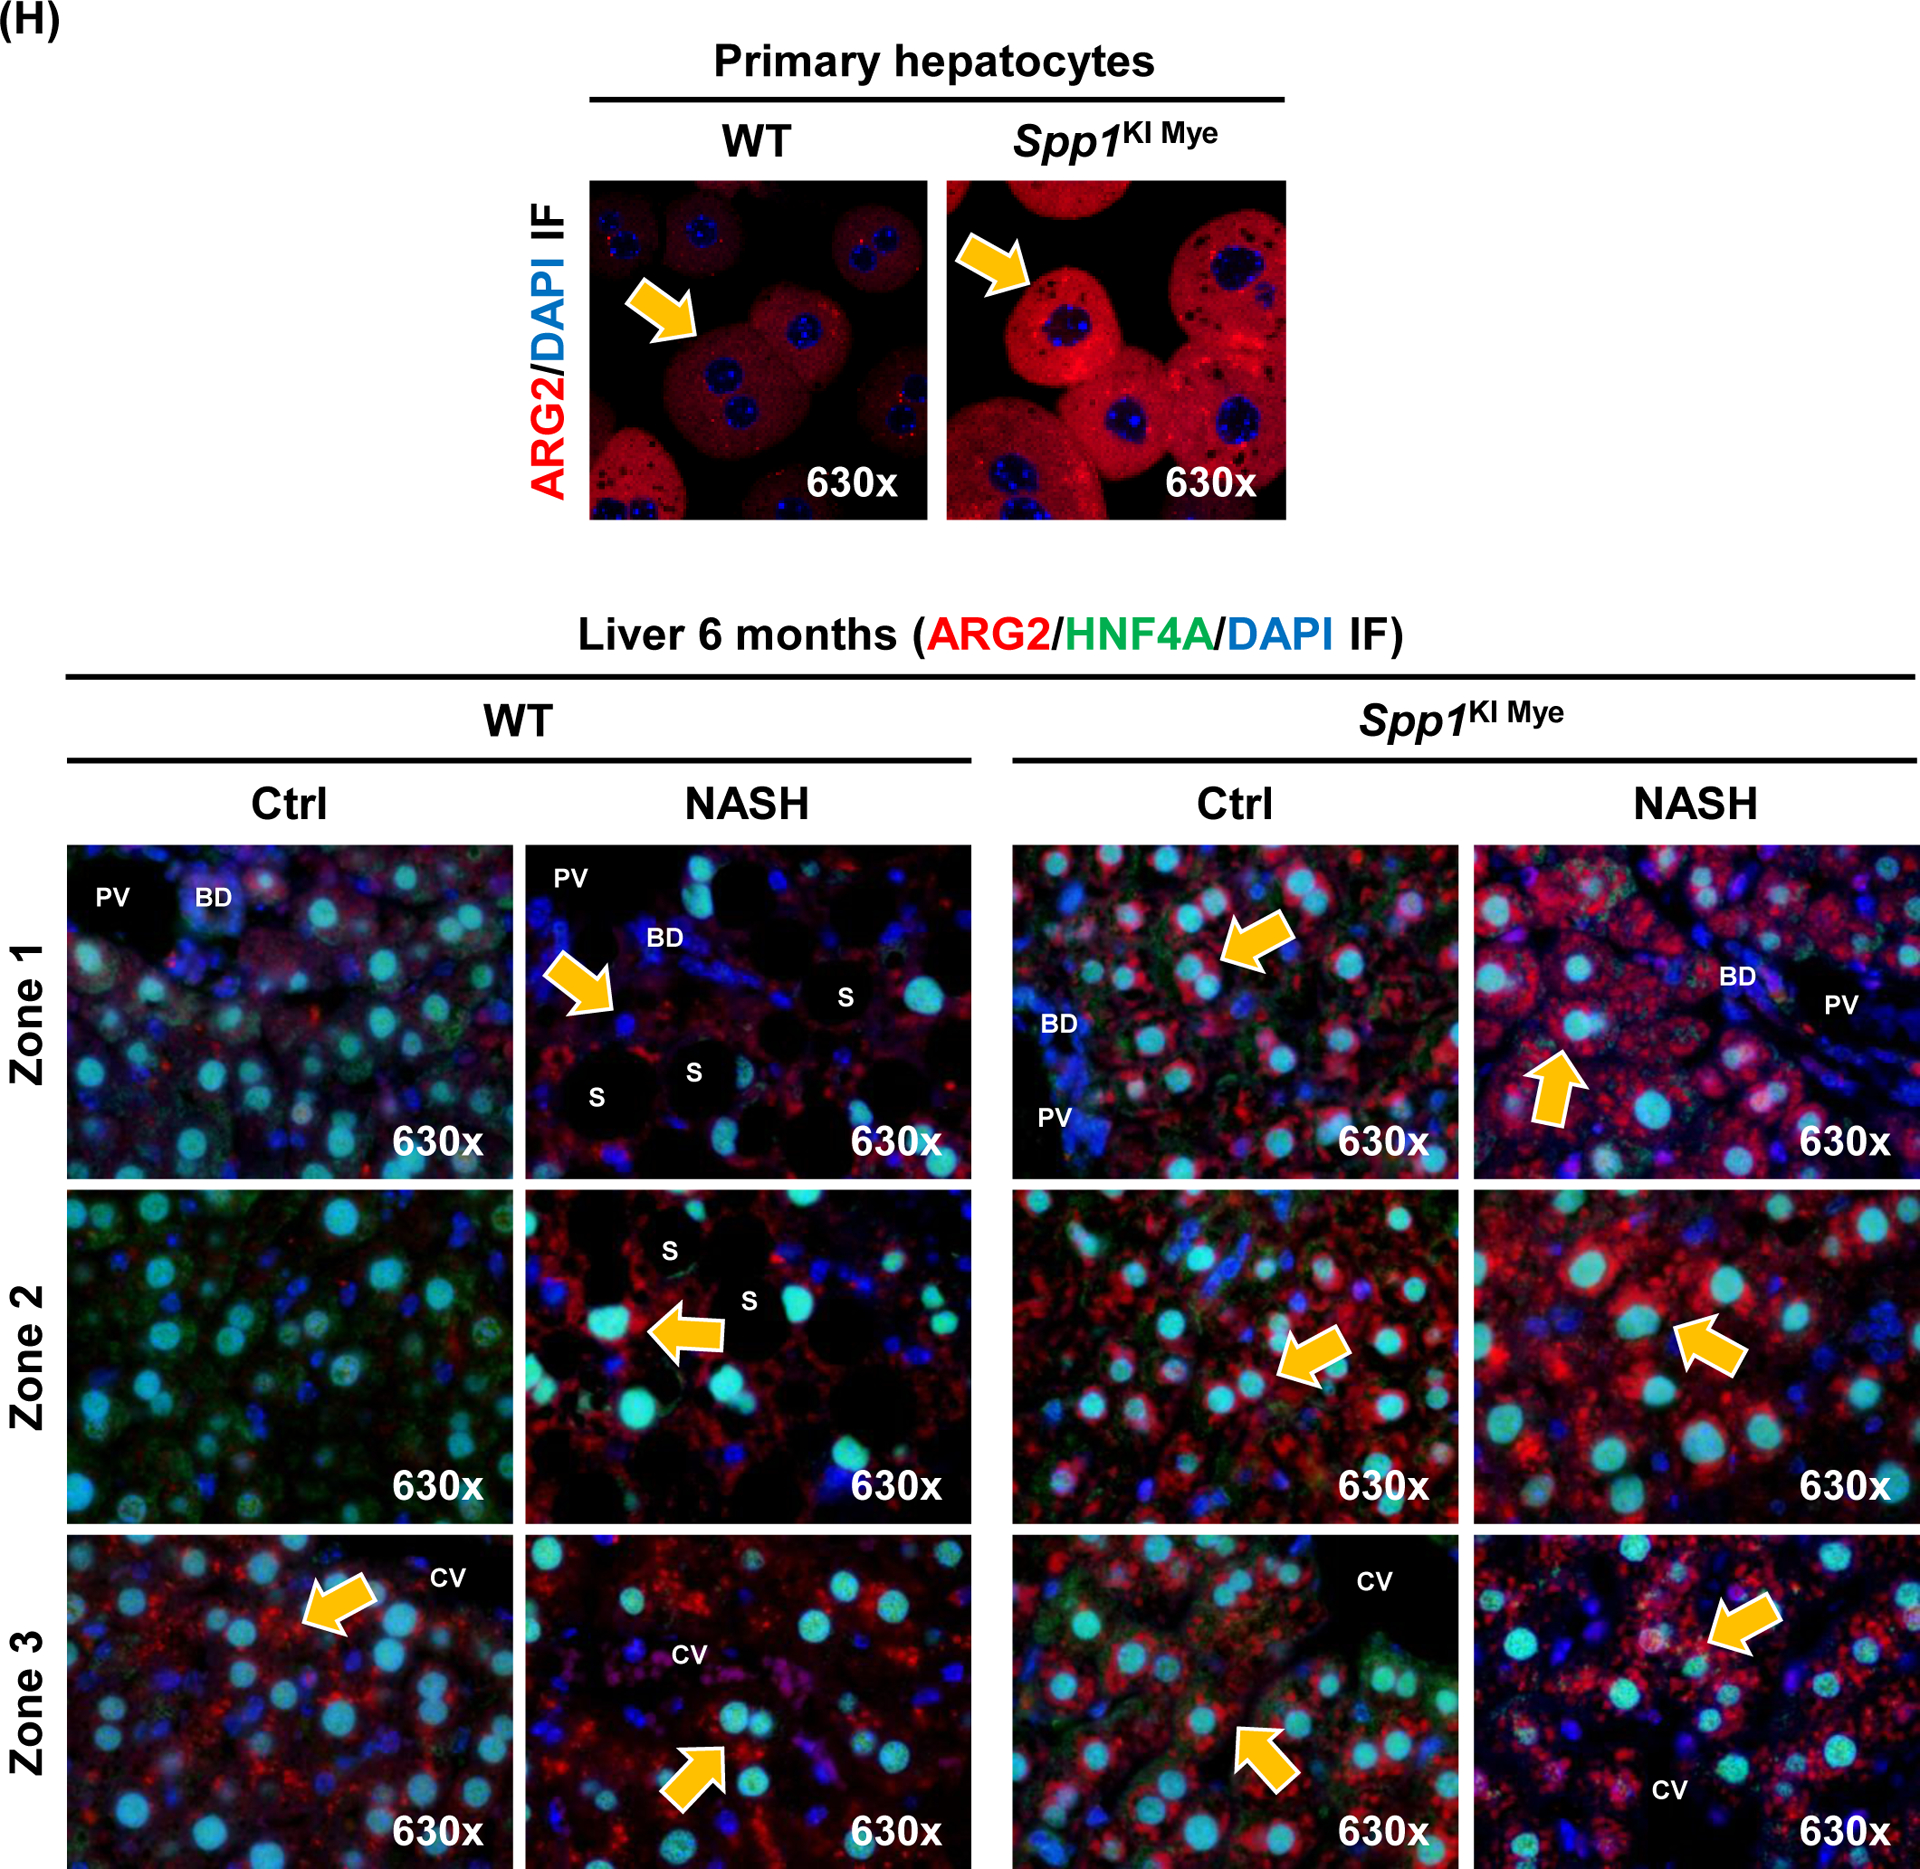
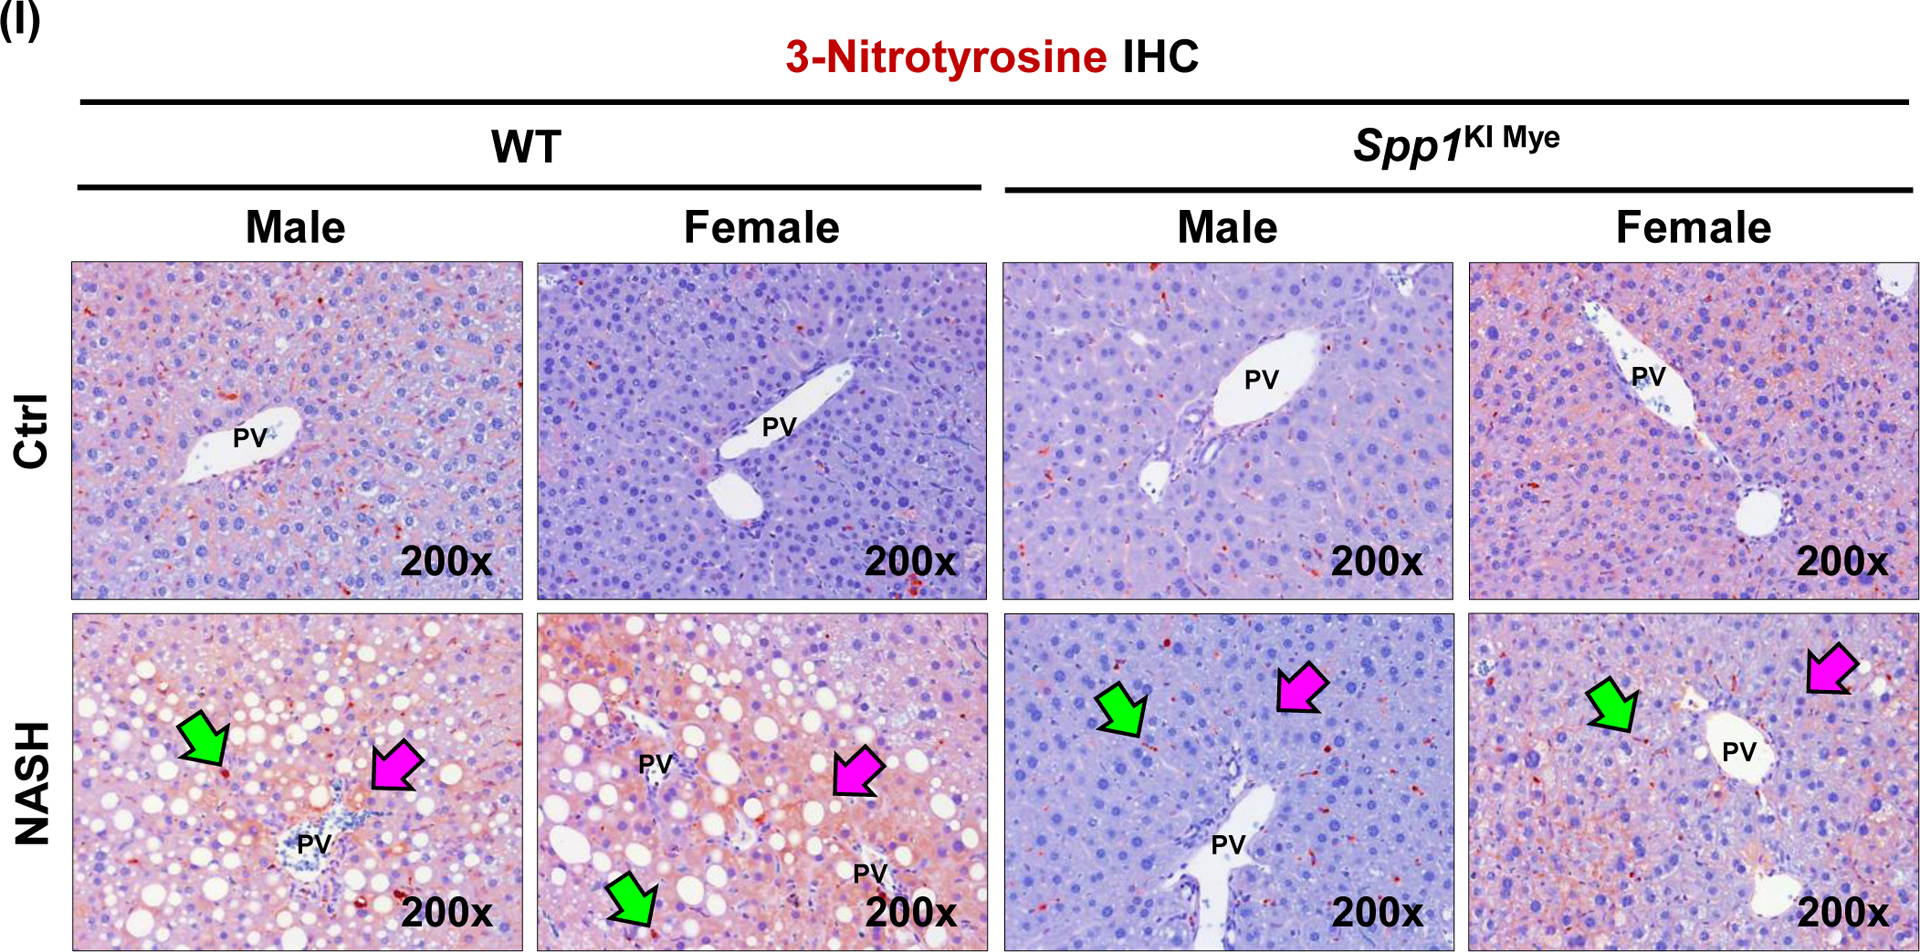
Spp1KI Mye and WT mice were fed for 6 months with control or NASH-inducing diet. Untargeted metabolomics and lipidomics analyses of the liver were performed. (A) Heat map of significantly changed TG species. Peak intensities are ordered by total number of carbon atoms (left) and saturation state (right). (B) Correlation heat map for downregulated TGs (cluster 3) and other metabolites. (C) Pathway enrichment for metabolites significantly correlated with downregulated TGs in Spp1KI Mye mice fed NASH-inducing diet. (D) Peak intensity of intermediates of urea cycle. (E) Serum urea concentration. (F) Serum ammonia concentration. (G) Relative mRNA expression of urea cycle enzymes. (H) Immunofluorescent staining of ARG2 in primary hepatocytes from untreated mice (top). Co-localization of ARG2 and HNF4A by zone in liver sections from Spp1KI Mye and WT mice fed control and NASH-inducing diet (CV, central vein; PV, portal vein; BD, bile duct; S, steatosis). (I) IHC of 3-NT (pink arrows: hepatocytes; green arrows: non-parenchymal cells). Results are expressed as mean ± SEM; n≥6/group. #p<0.05 and ##p<0.01 vs. control with same genotype; *p<0.05, **p<0.01 and ***p<0.001 vs. WT with same diet.
