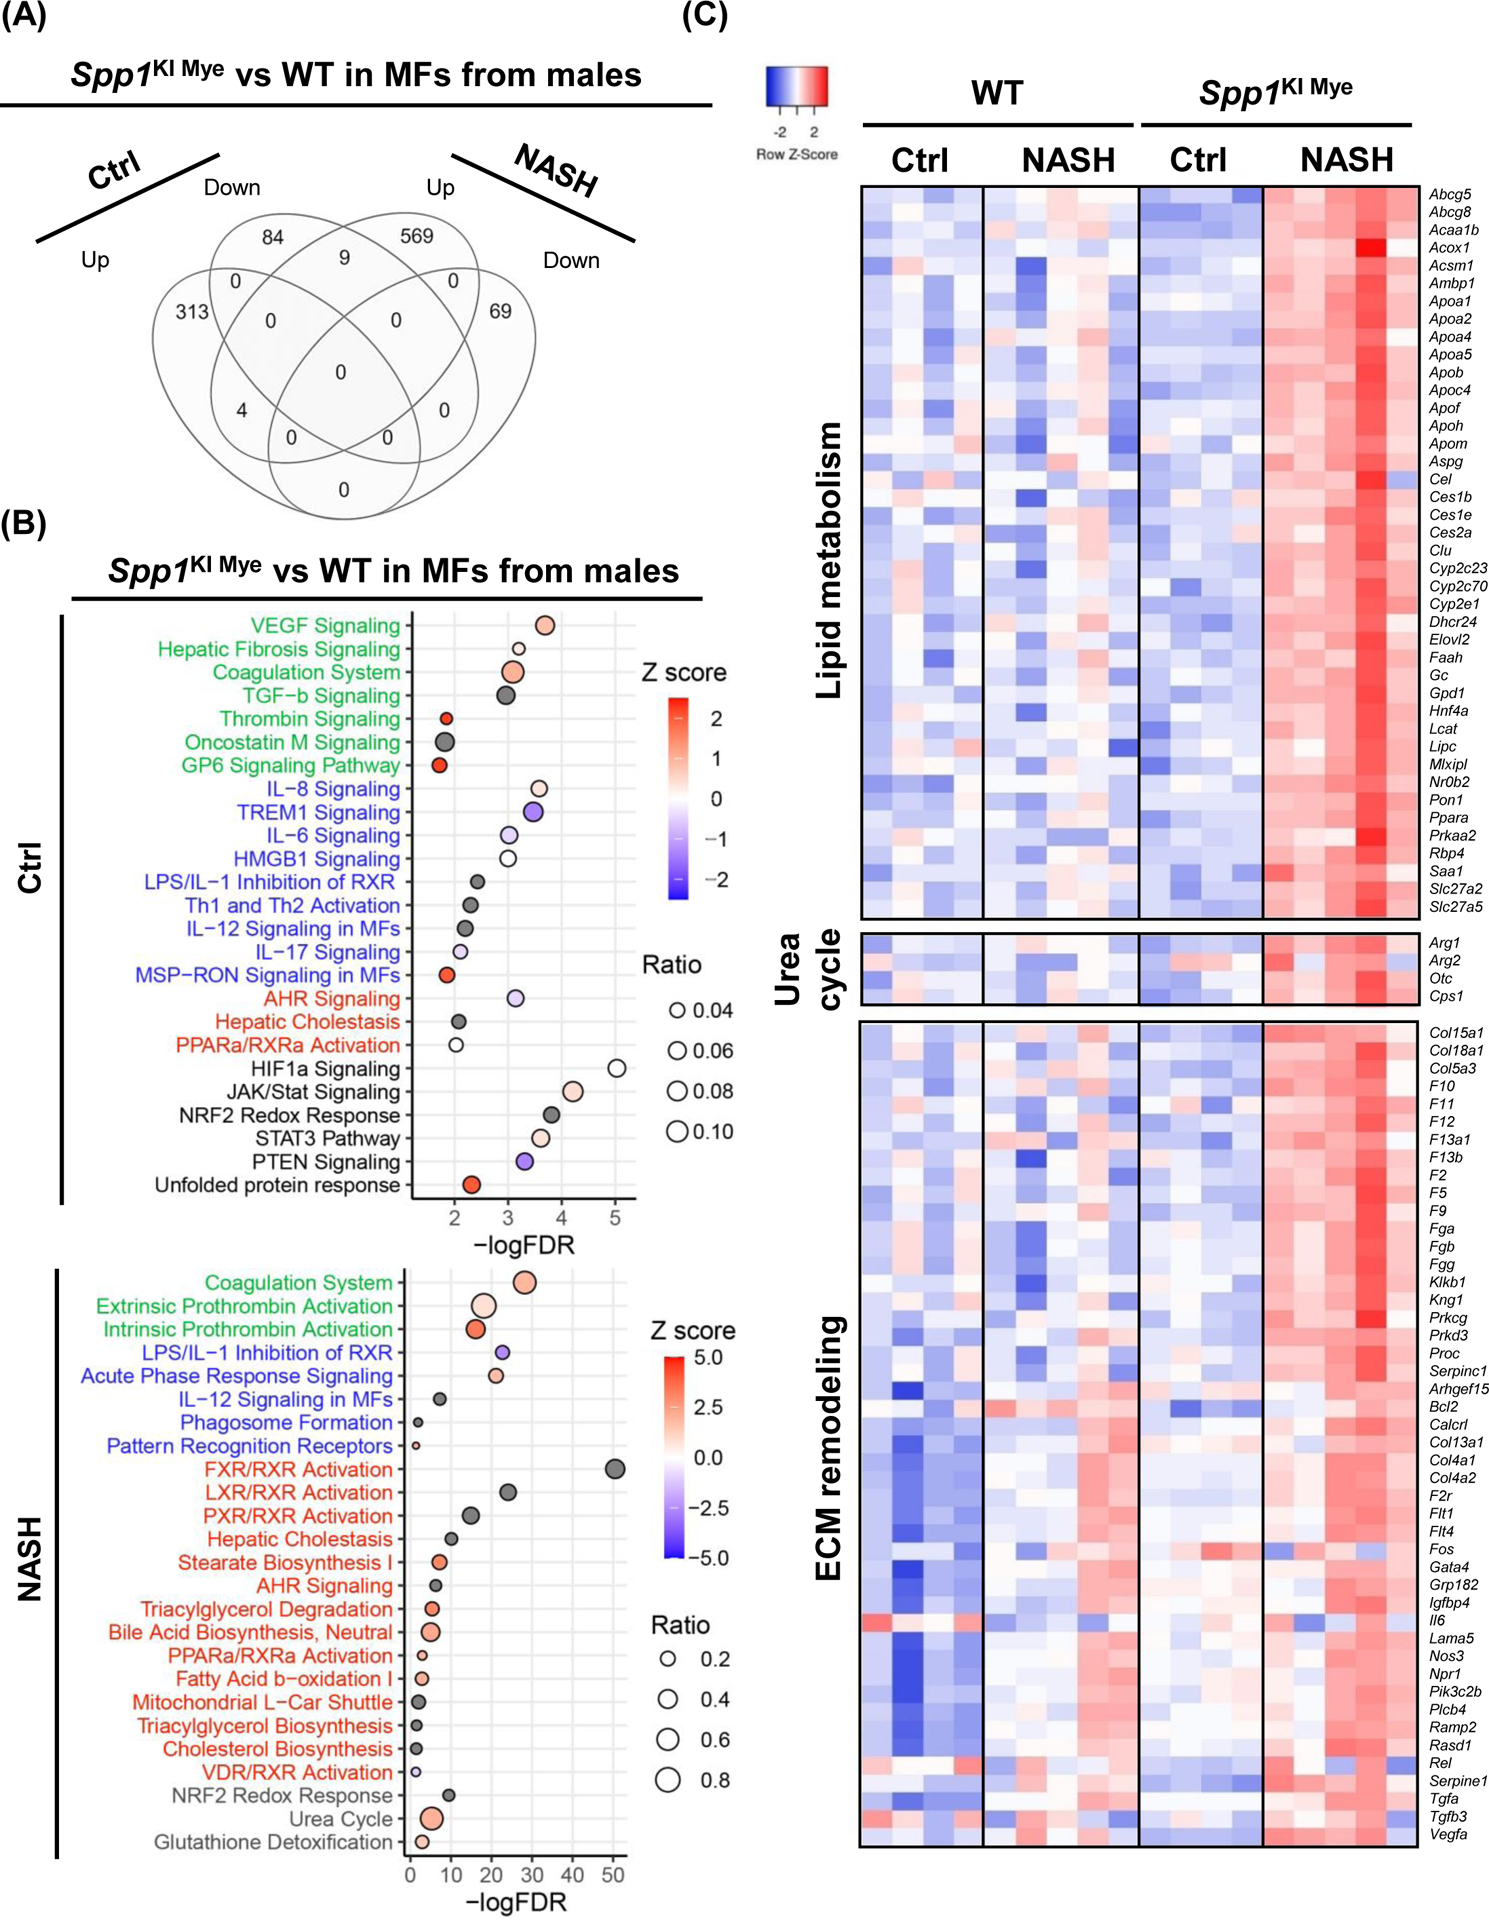
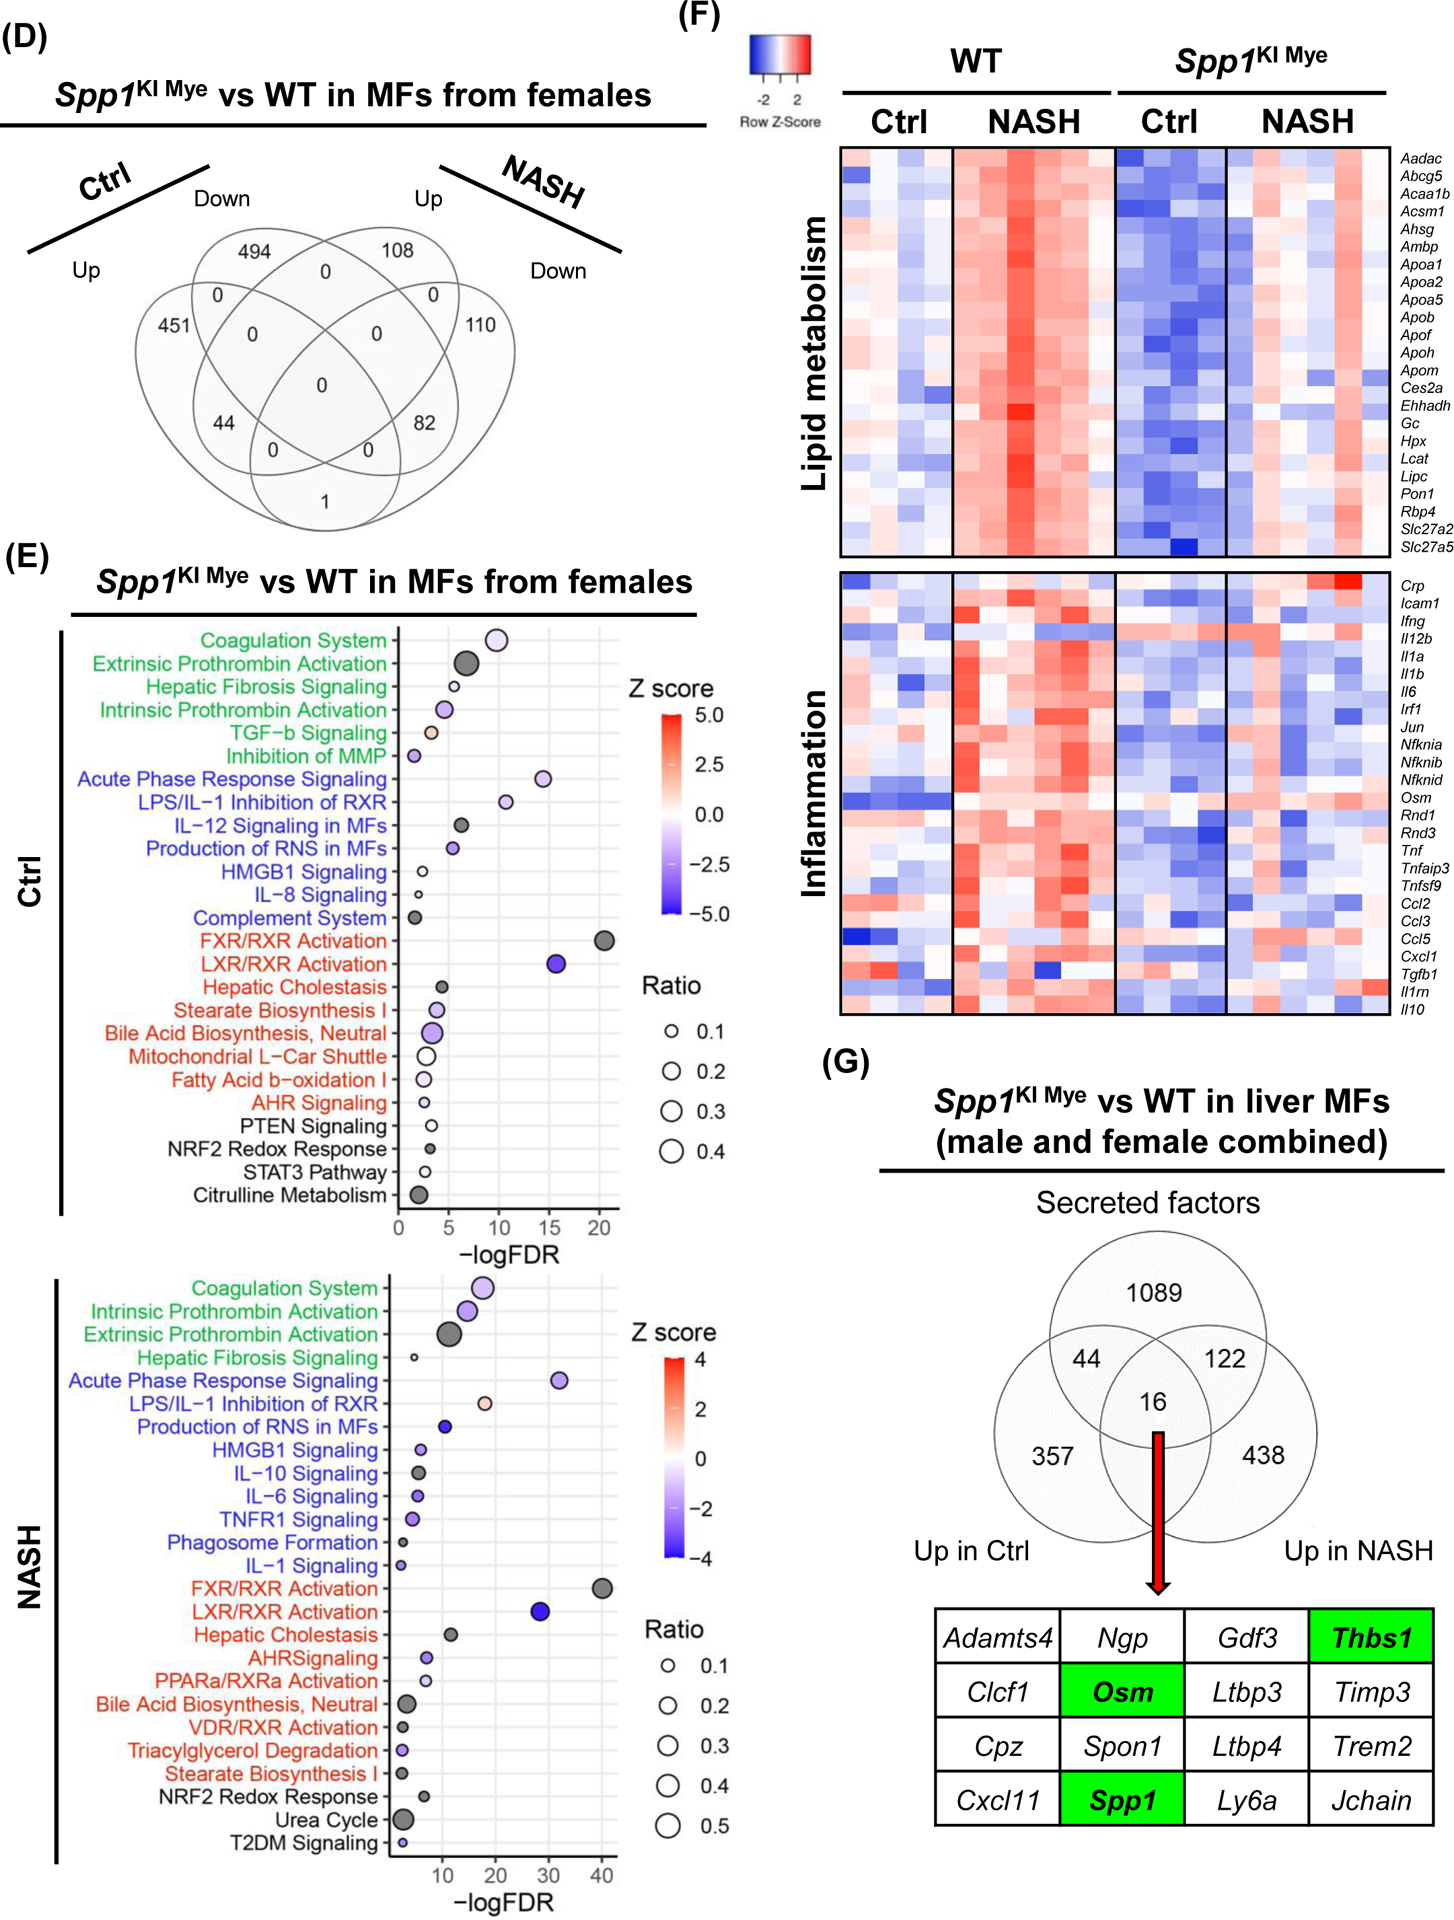
Figure 5. Spp1KI Mye and feeding NASH-inducing diet drive the sex-specific transcriptome in MFs.


Spp1KI Mye and WT mice were fed for 6 months with control or NASH-inducing diet. Liver resident MFs were sorted, transcriptomics performed, and analyzed by EdgR followed by pathway analysis of DE genes with IPA. (A) Venn diagram of DE genes in MFs from males. (B) Dot plot of 25 representative pathways altered in MFs of Spp1KI Mye males fed control (top) or NASH-inducing diet (bottom). Pathways highlighted in green, blue, red and black indicate tissue remodeling, inflammation, lipid metabolism and other, respectively. (C) Heat map of genes involved in lipid metabolism, urea cycle, and tissue remodeling in MFs from males. Expression was normalized by log2 CPM. (D) Venn diagram of DE genes in MFs from females. (E) Dot plot of 25 representative pathways altered in MFs of Spp1KI Mye females fed control (top) or NASH-inducing diet (bottom). (F) Heat map of genes involved in lipid metabolism and inflammation in MFs from females. (G) Venn diagram of genes upregulated in MFs from Spp1KI Mye mice fed control or NASH-inducing diet overlapping with mouse secreted factors.
