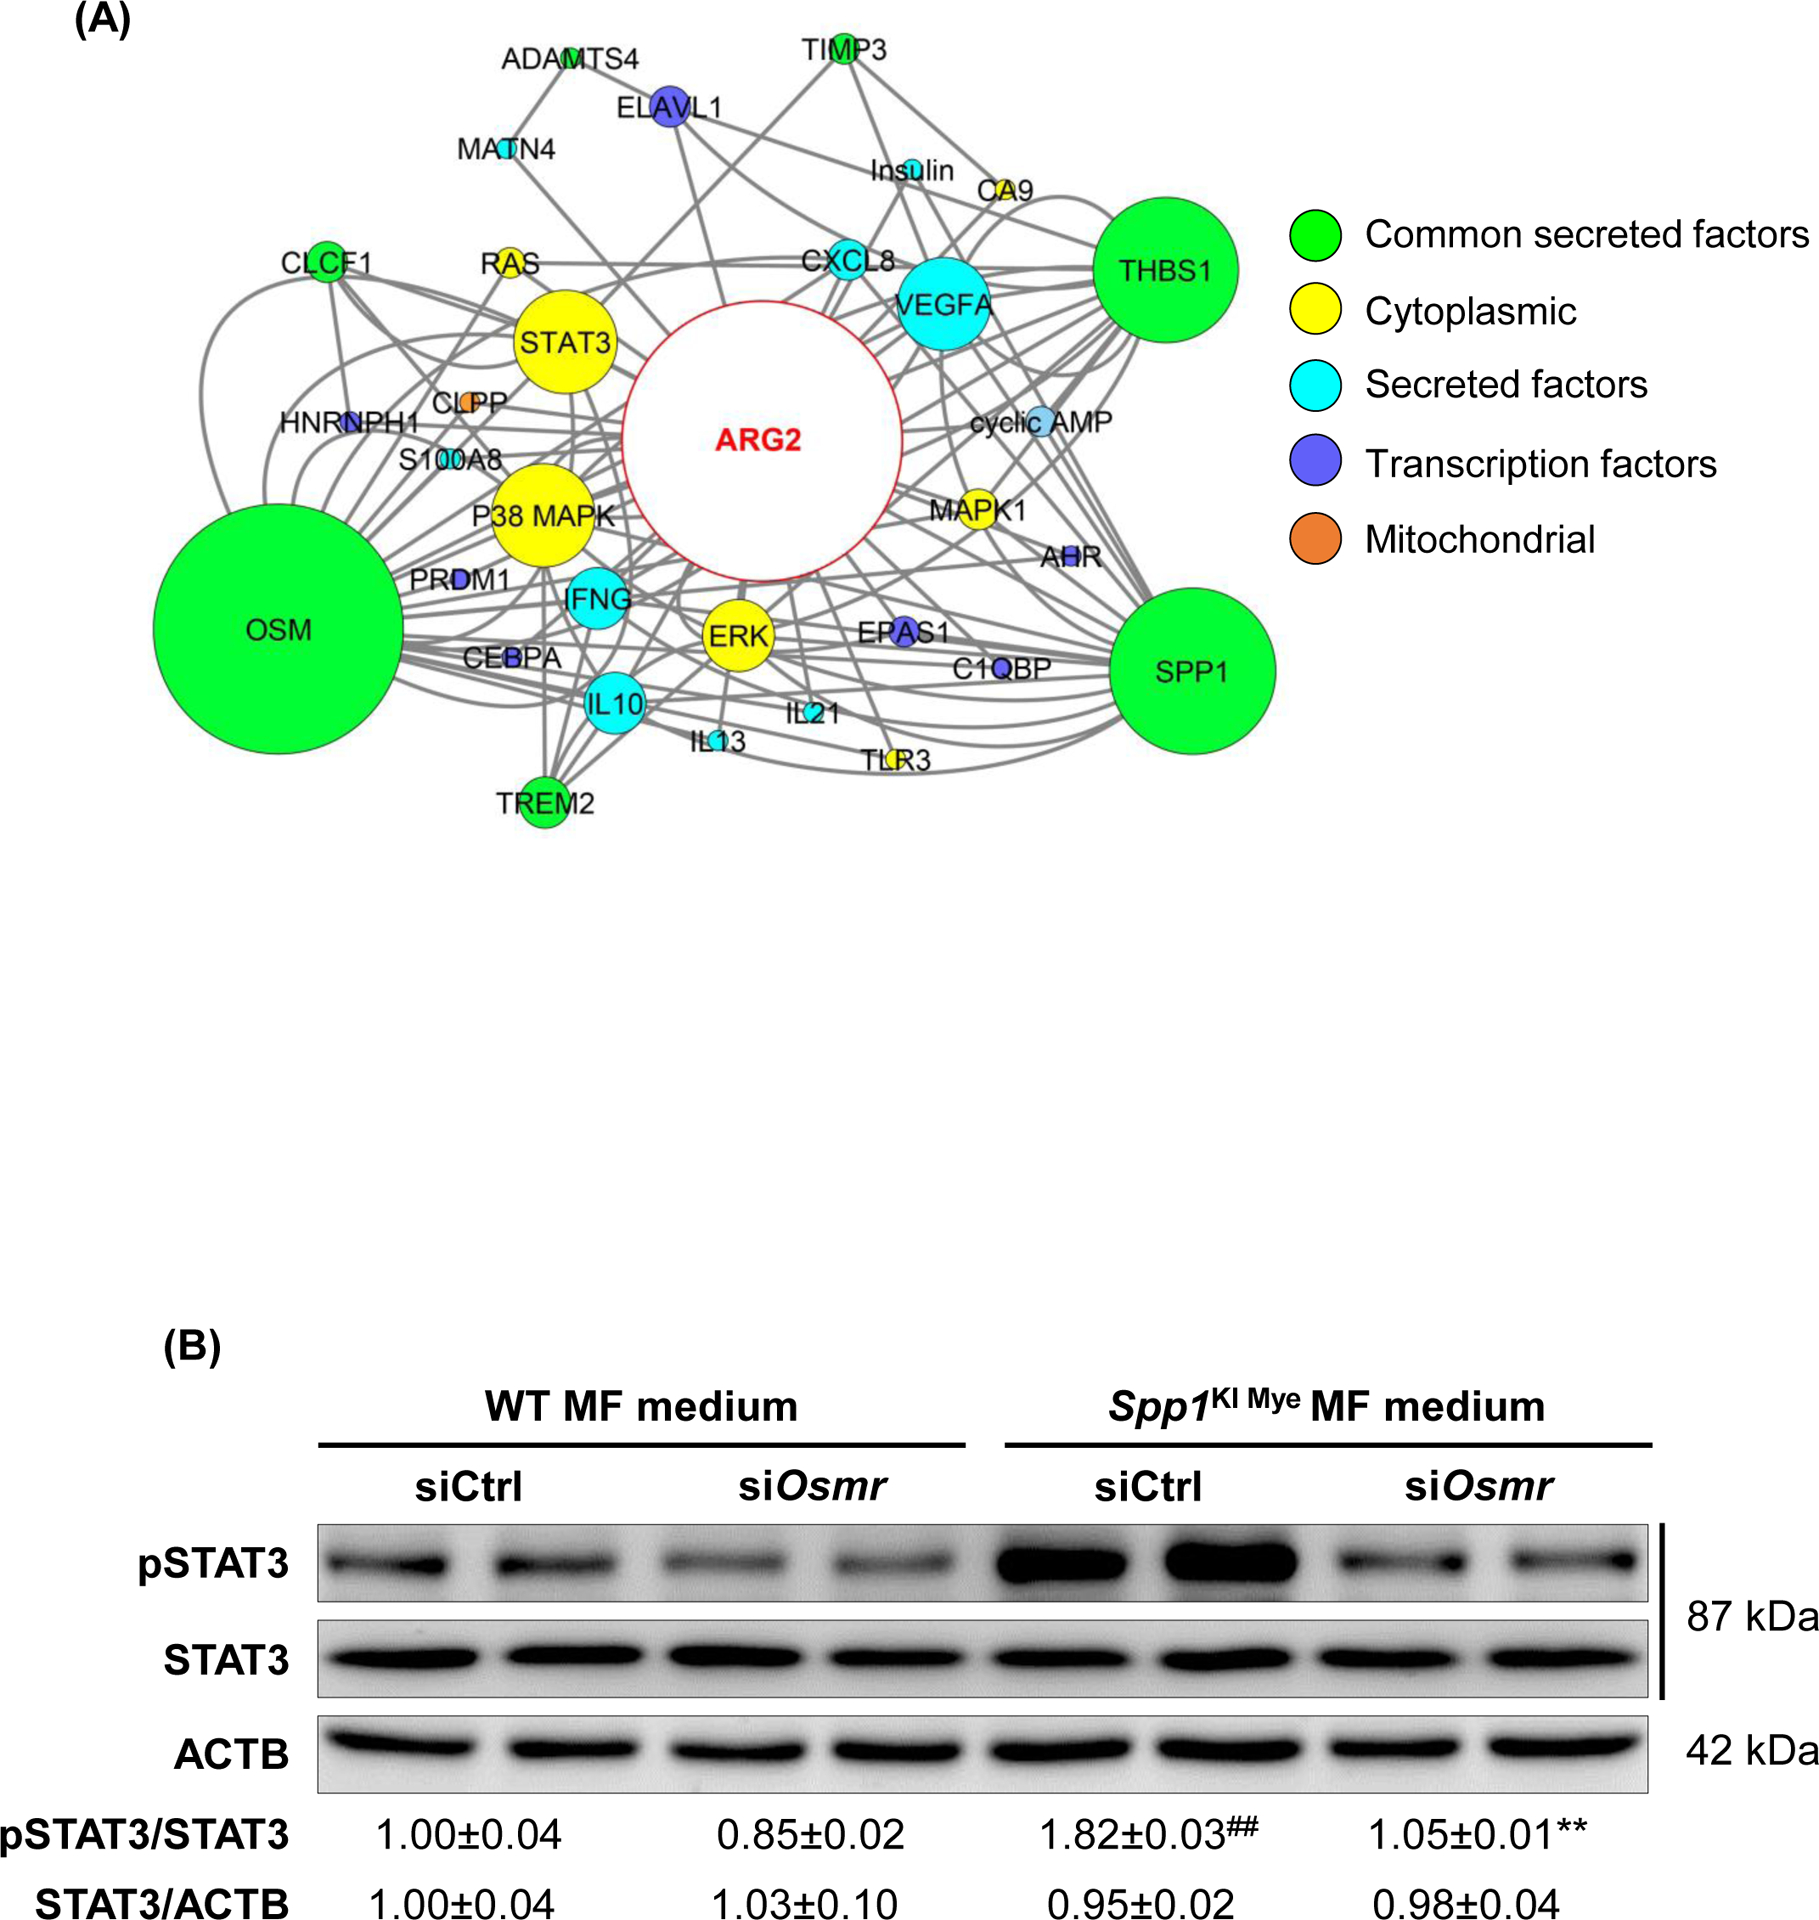
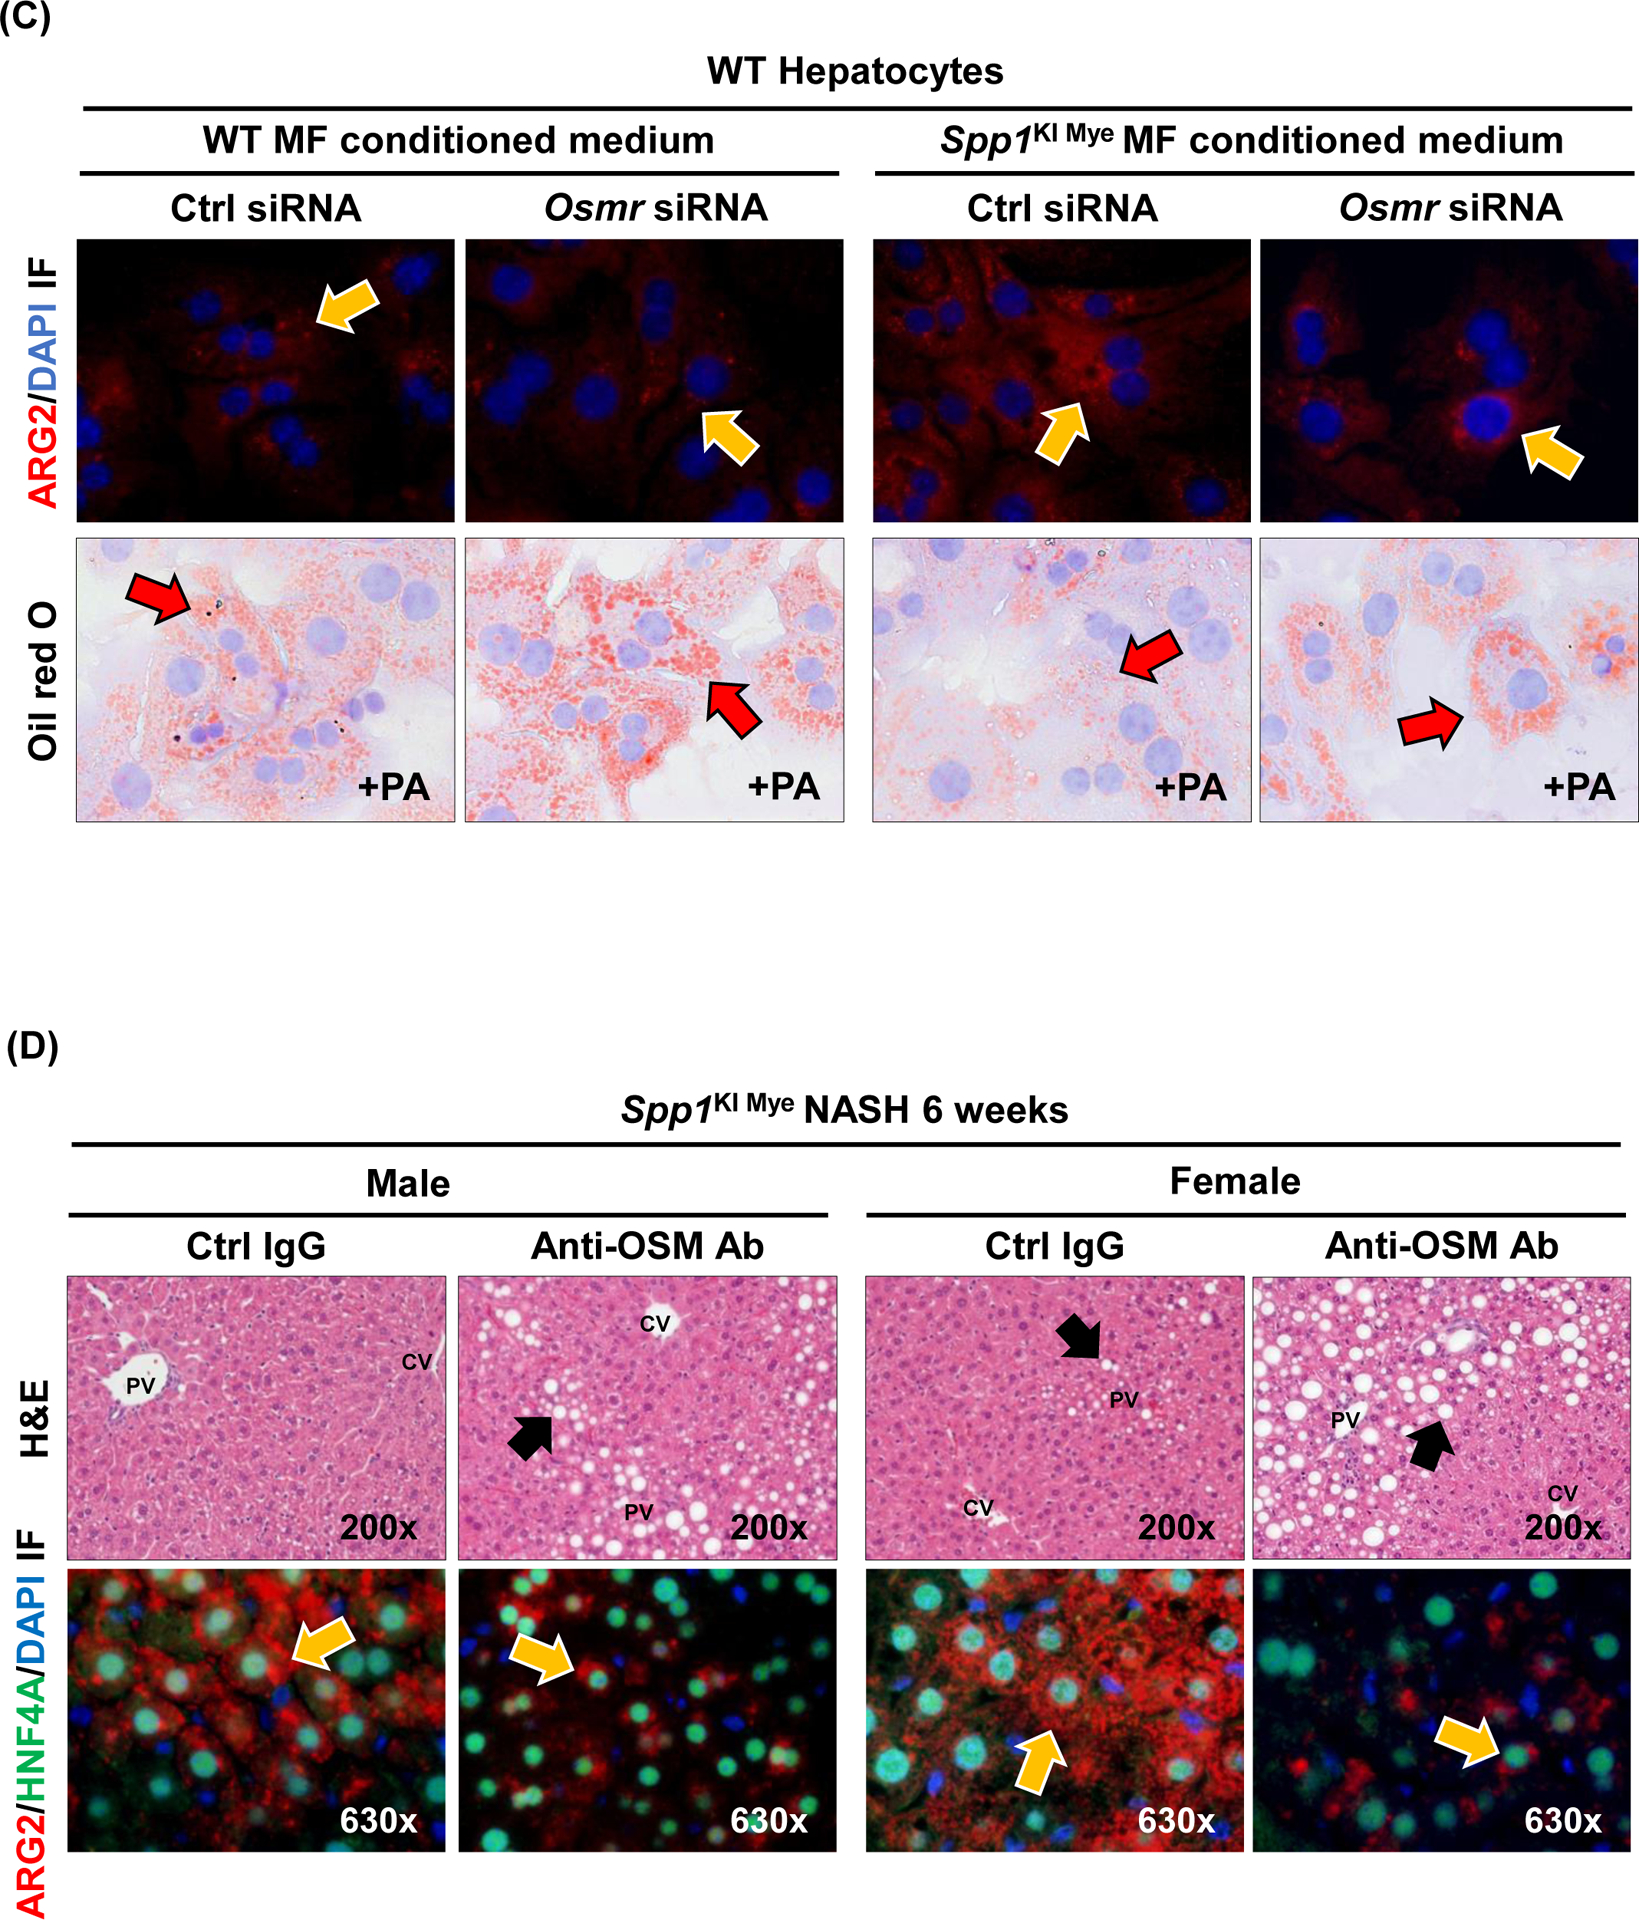
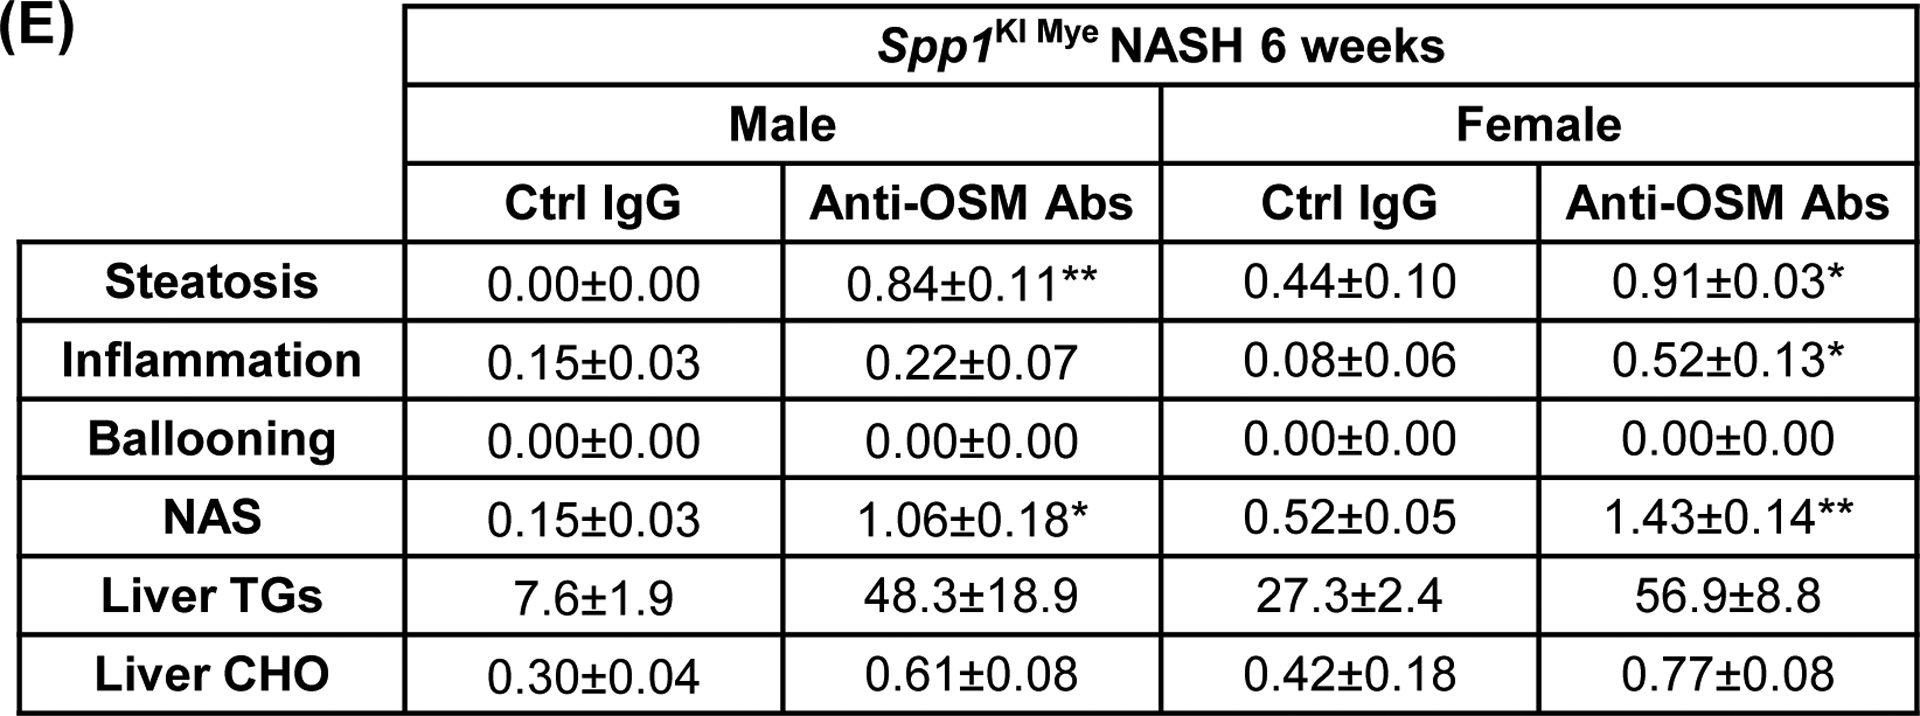
Figure 6. Spp1KI Mye drives expression of oncostatin-M (OSM), which induces Arg2 through STAT3.


(A) Network landscape generated by Cytoscape indicating potential pathways leading to Arg2 upregulation (colors indicate subcellular localization; circle size indicates number of interactions). (B) Primary WT and Osmr null hepatocytes were cultured with conditioned medium of MFs from WT and Spp1KI Mye mice. Western blot of pSTAT3, STAT3 and ACTB; n=4, ##p<0.01 vs WT; **p<0.01 vs Ctrl siRNA. (C) ARG2 IF (yellow arrows: ARG2 expression in HEPs) and oil red O staining (red arrows: lipid droplets) of hepatocytes incubated with 30 μM BSA-conjugated-PA for 24 hours. (D) Spp1KI Mye mice were injected an OSM neutralizing antibody or isotype control (0.25 μg/g, 10 doses every other day from the fourth week of NASH), while fed NASH-inducing diet. H&E staining of liver (black arrows: macrovesicular steatosis) (top) and co-localization of ARG2 and HNF4A (bottom, yellow arrows: ARG2+HNF4A+ cells). (E) Individual scores, NAS, liver TGs and CHO normalized by protein (n=3/group). *p<0.05 and **p<0.01 vs. Ctrl IgG.
