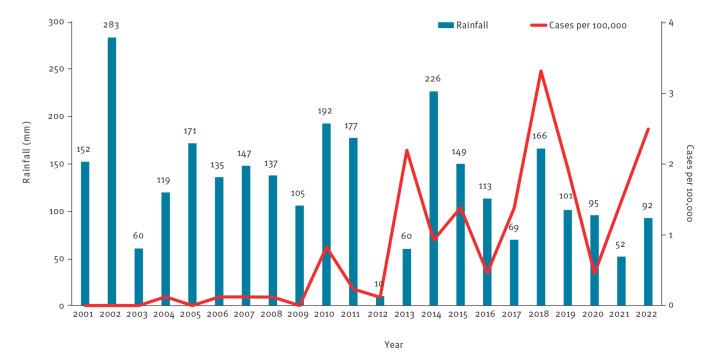
Figure 4.
Total rainfall and curve of leishmaniasis cases during the summer months, local health unit of Bologna, northern Italy, June, July and August, 2001–2022
Data on summer rainfall were extracted by Dext3r (https://simc.arpae.it/dext3r). The weather stations for reference are located in the city of Bologna, 80 m above sea level. Numbers on the tops of each histogram represent mm of rainfall by year during June, July and August.

