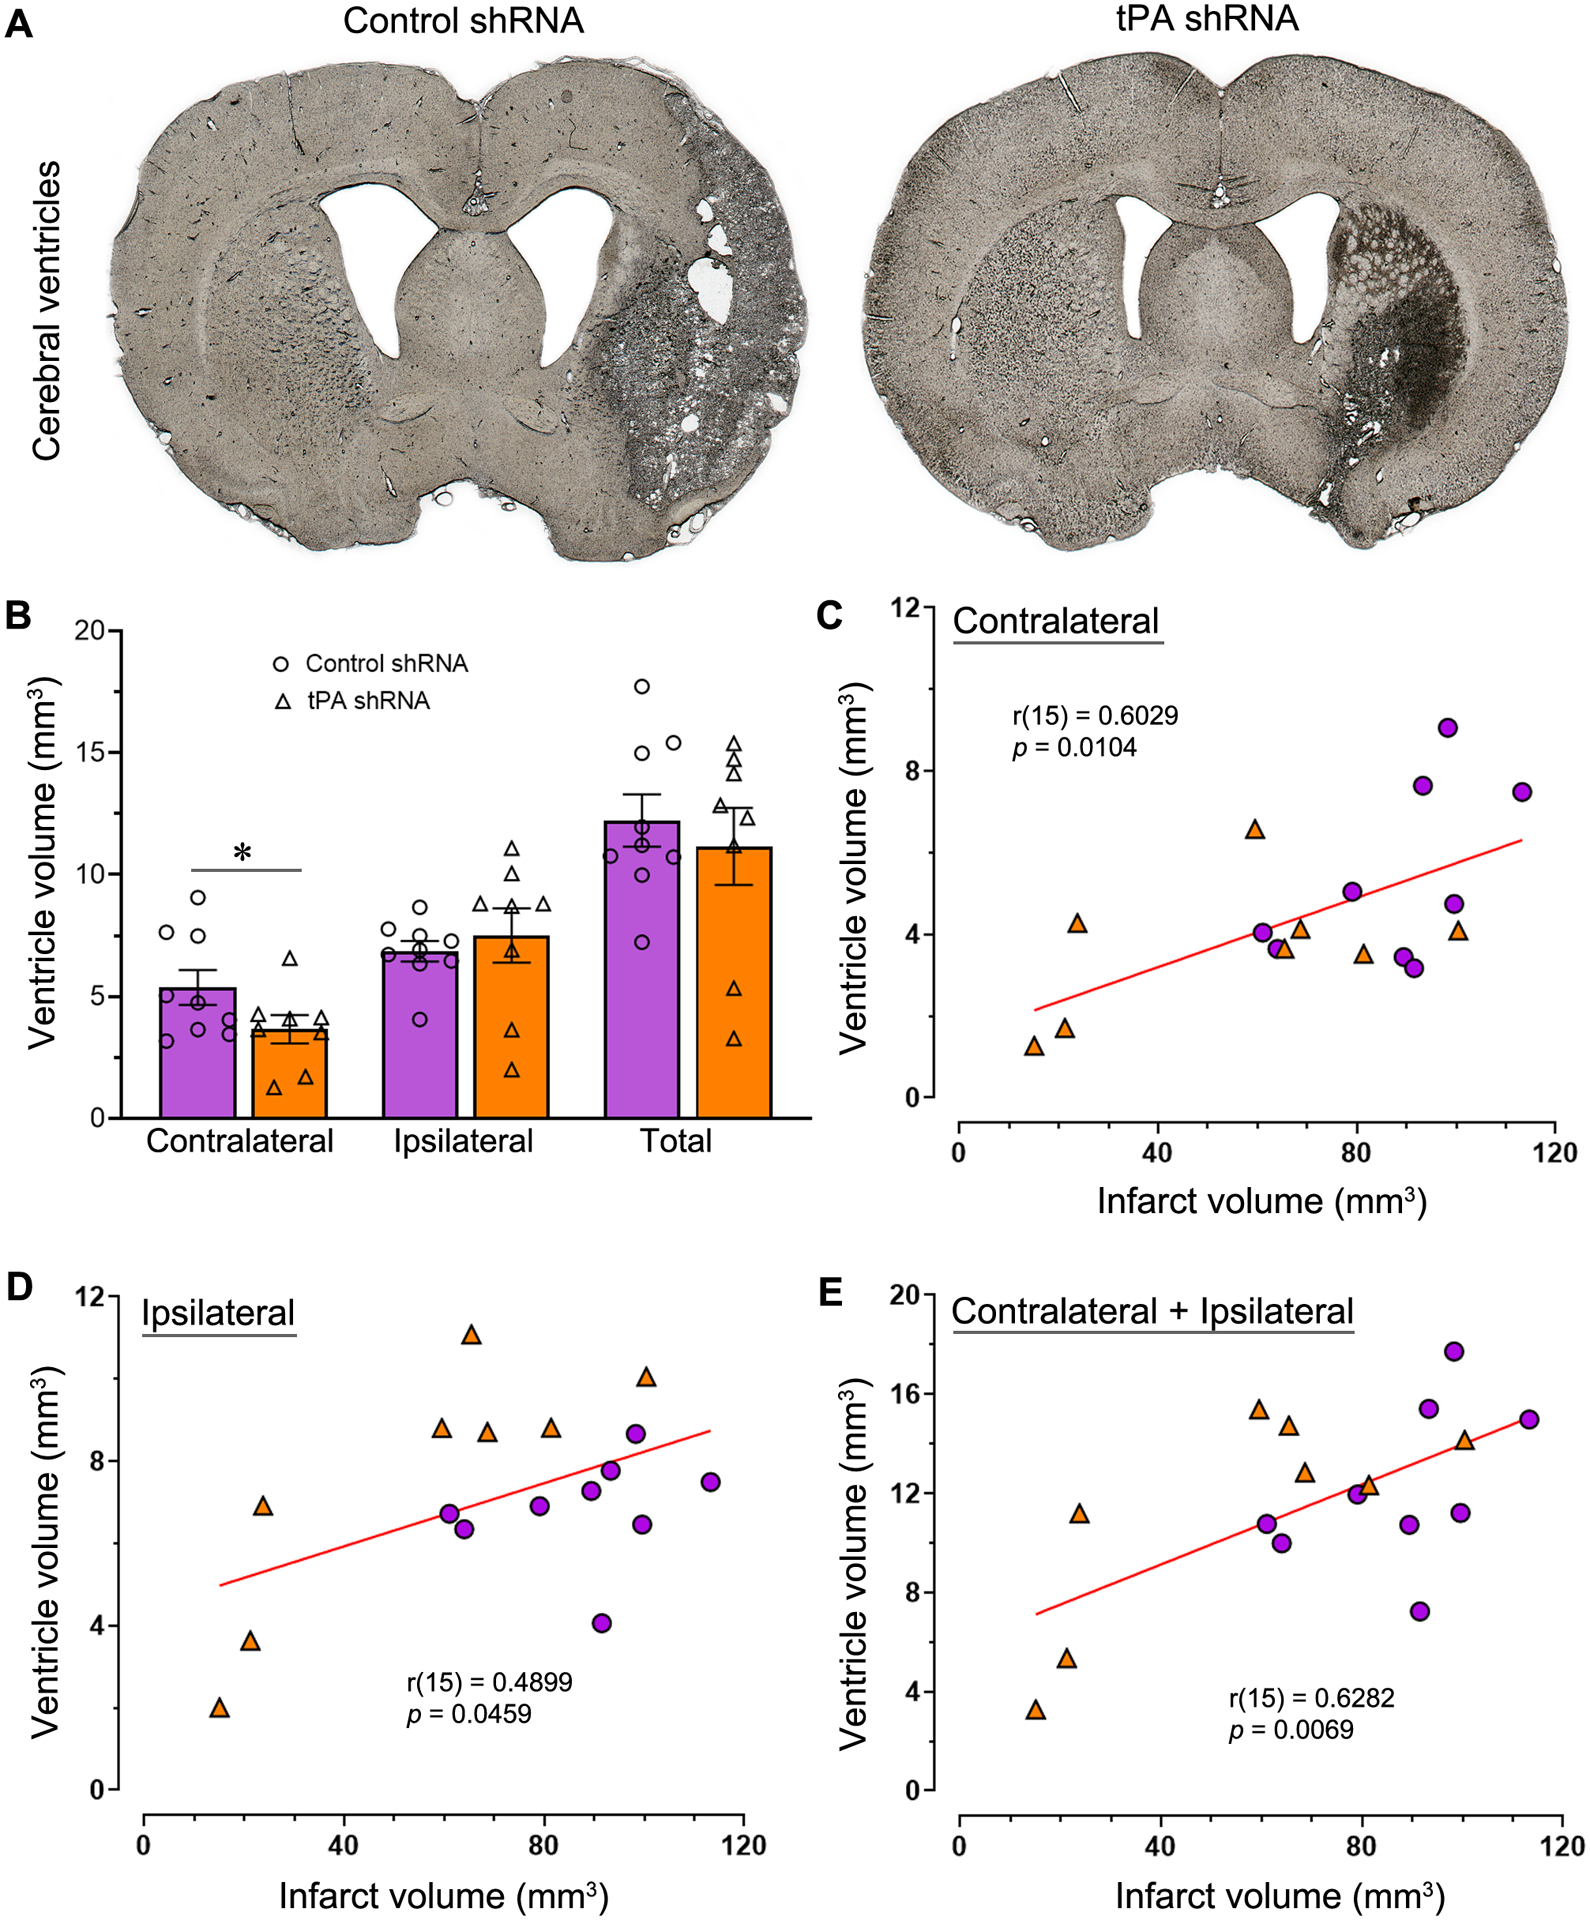
Fig. 6.

tPA shRNA treatment promptly after reperfusion reduces cerebral ventricle volume enlargement. (A) Representative coronal brain sections from the control shRNA and tPA shRNA groups depicting lateral ventricles. (B) The column scatter plot shows the quantified whole brain ventricle volume as well as the contralateral and ipsilateral ventricle volumes. Columns indicate the mean and error bars indicate the SEM. *p < 0.05 (tPA shRNA group vs control shRNA group). (C, D, E) Scatter plots show the correlation between infarct volume and contralateral brain ventricle volume (C), ipsilateral ventricle volume (D), and whole brain ventricle volume (E). Small circles represent data of the control shRNA group; triangles represent data of the tPA shRNA group.
