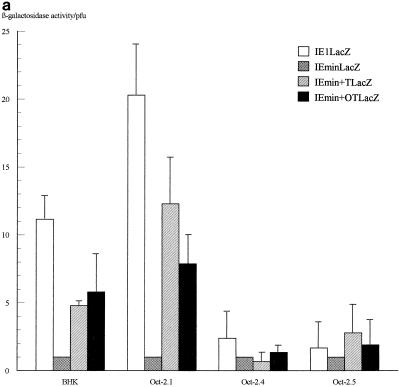
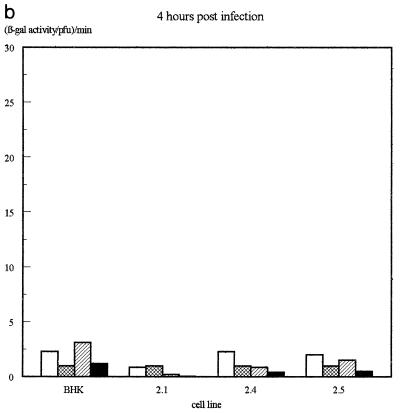
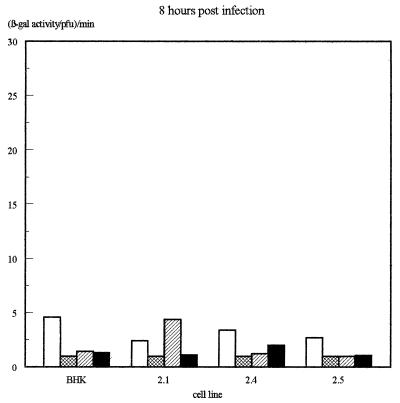
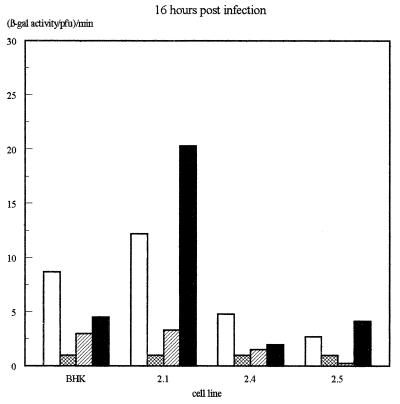
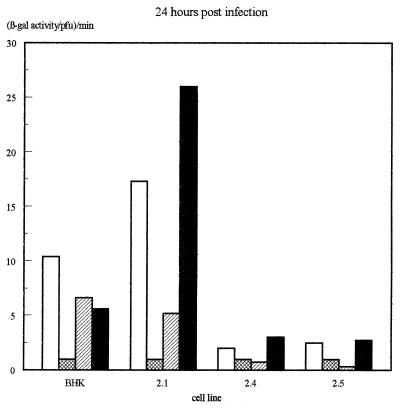
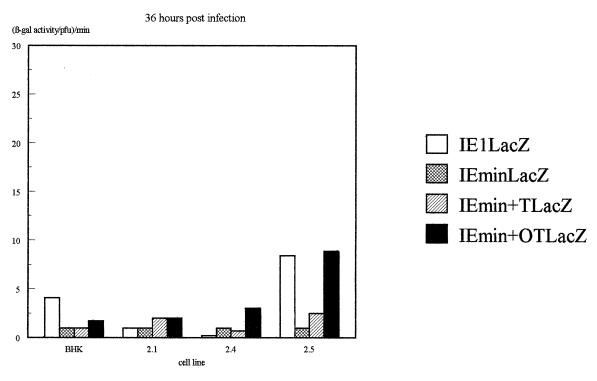
FIG. 4.
Assay of β-galactosidase activity produced by each virus on each of the cell lines. (a) β-Galactosidase activities assayed at 16 h postinfection. Shown are averages of three independent experiments. Error bars indicate standard deviations. (b) Results of a time course experiment. In each case, values have been expressed as β-galactosidase activity per PFU of virus as assayed by titrating the virus harvested at each time point on permissive Vero cells.

