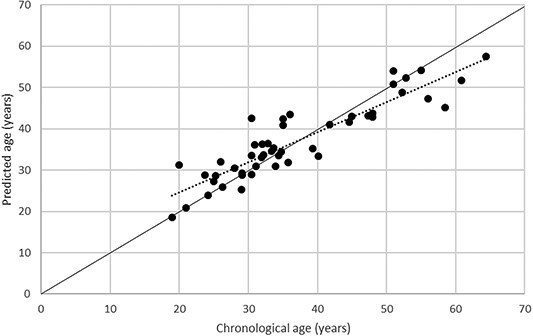
Figure 1.

Chronological age of the participants plotted against the predicted age estimated using the age assay. Solid line: the perfect correlation between estimated and chronological age according to the MLR model [11]; dotted line: the line with the best fit (R2 =0.8234) between the predicted and the chronological age in the dataset.
