
Figure 2.
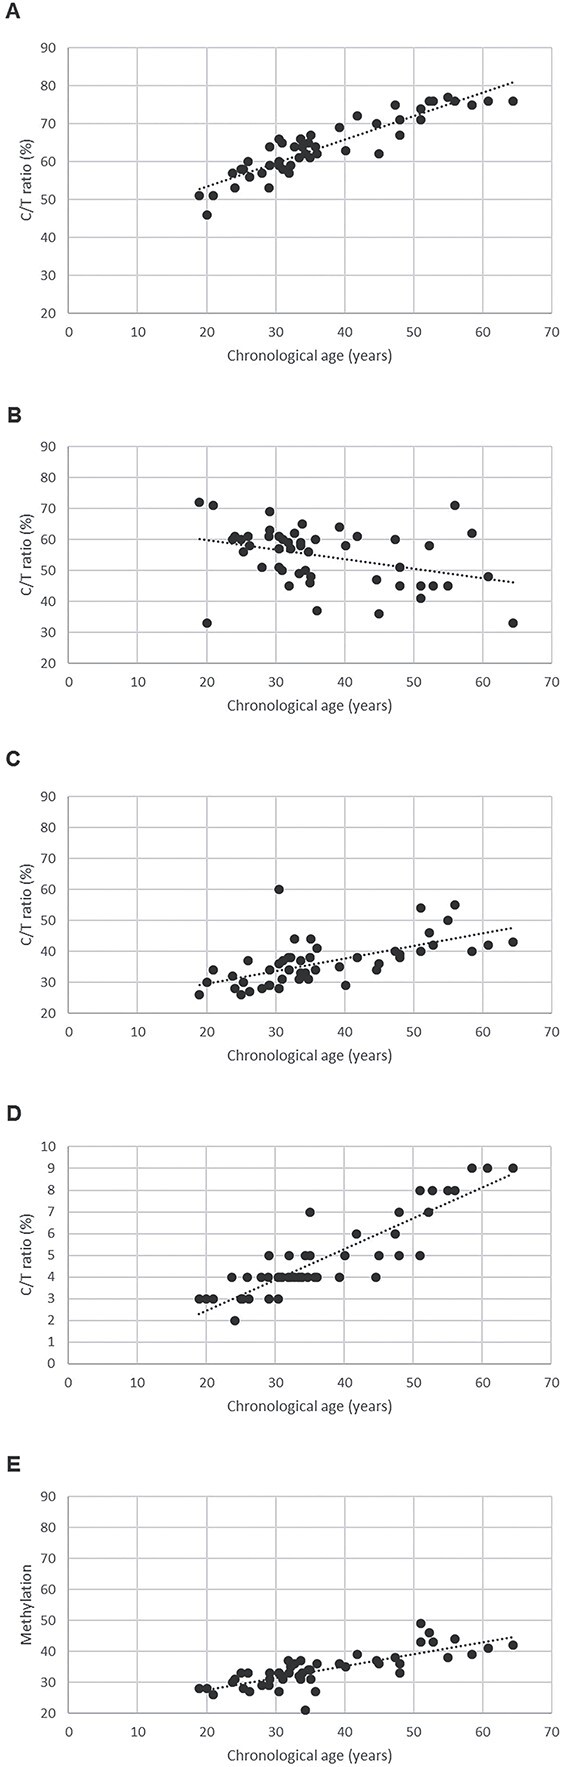
Chronological age plotted against C/T ratio. (A) ELOVL2 locus (R2 = 0.8230), (B) C1orf132 locus (R2 = 0.1314), (C) TRIM59 locus (R2 = 0.3237), (D) KLF14 locus (R2 = 0.7920), and (E) FHL2 locus (R2 = 0.6120). For comparison, all vertical axes are of the same size with the exception of KLF14 given the very low C/T ratios for this locus.