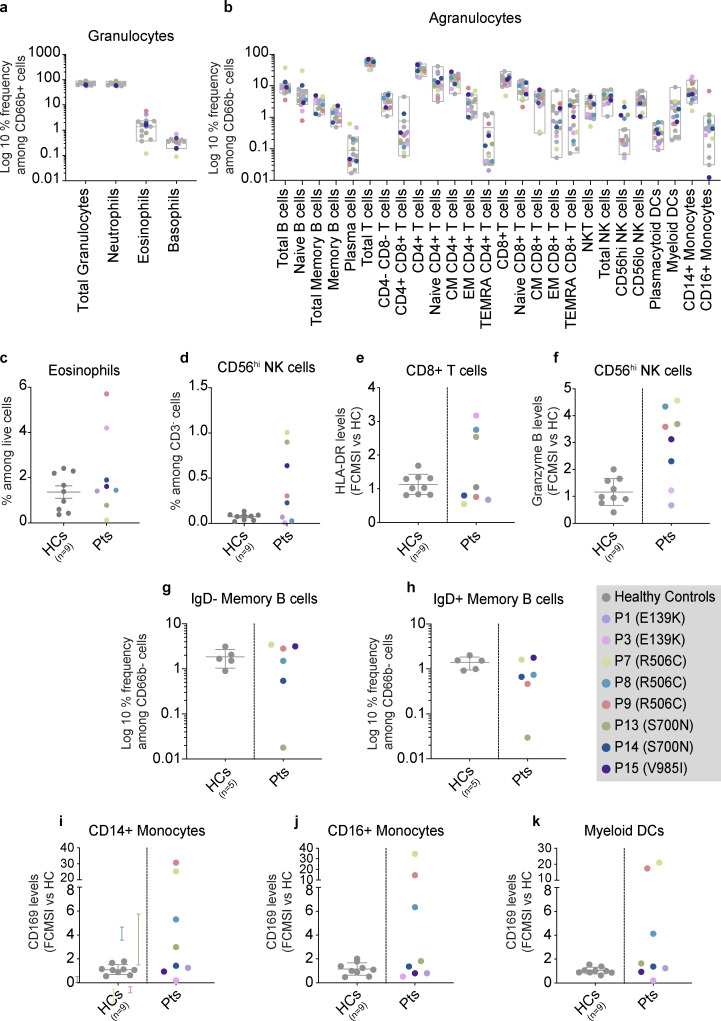
Figure 4.
Ex vivo assessment of individuals with JAK1 variants by whole blood CyTOF. (a and b) Granulocytes (a) and agranulocytes (b) in whole blood from individuals with JAK1 variants and HCs. Results are depicted as log10-transformed percent frequencies of CD66b+ cells and CD66b− cells, respectively. Gray box plots represent HC ranges (min-max) with the middle bar representing the average for HCs. For panels a and b, number of HCs for each patient are as follows: P3 n = 3; P7 n = 4; P9 n = 2; P13 n = 4; P15 n = 4. For panel b, CM = central memory; EM = effector memory; TEMRA = T effector memory CD45RA+; NKT = NK T cells; NK = natural killer. Populations labeled “granulocytes” comprise all CD66b+ cells (including neutrophils, eosinophils, and basophils). (c and d) Percent frequencies of manually gated (c) eosinophils and (d) NK cells in whole blood from individuals with JAK1 variants and healthy controls (HCs). HC group (n = 9) labeled as “HCs.” Patient group (n = 8) labeled as “Pts.” Results are expressed as a percent of live cells for eosinophils and as a percent of CD3− cells for CD56hi NK cells. Each point represents a single subject. Bars and whiskers represent the mean ± SEM for that group. (e and f) Baseline levels of (e) HLA-DR and (f) granzyme B in manually gated CD8+ T cells and CD56hi NK cells respectively. Levels measured in whole blood from individuals with JAK1 variants compared to HCs. For panels a and b, results are expressed as fold-change in mean signal intensity (FCMSI) over the average of nine HCs. Number of HCs for each patient are as follows: P3 n = 3; P7 n = 4; P9 n = 2; P13 n = 4; P15 n = 4. Results are from four independent runs with 1 (P1 and P3) or 2 (P7, P8, P9, P13, P14, P15) technical replicates. Gray bars and whiskers represent the mean ± SEM for HCs. (g and h) Percent frequencies of (g) IgD negative and (h) IgD positive memory B cells in whole blood from individuals with JAK1 variants. Results expressed as the log10-transformed percent frequencies of CD66b− cells (agranulocytes). The number of HCs from three independent runs are as follows: P7 and P15, n = 2; P8 and P9, n = 2; P13 and P14, n = 1. There was no biological sample available for this experiment from Kindred I (P1 and P3), therefore IgD status was not assessed. (i–k) Baseline CD169 levels in (i) CD14+ monocytes, (j) CD16+ monocytes, and (k) myeloid DCs in whole blood from individuals with JAK1 variants compared to HCs. Results expressed as FCMSI over the average of nine HCs. Number of HCs for each patient are as follows: P3 n = 3; P7 n = 4; P9 n = 2; P13 n = 4; P15 n = 4. Results are from four independent runs with 1 (P1 and P3) or 2 (P7, P8, P9, P13, P14, P15) technical replicates. Gray bars and whiskers represent the mean ± SEM for HCs.

