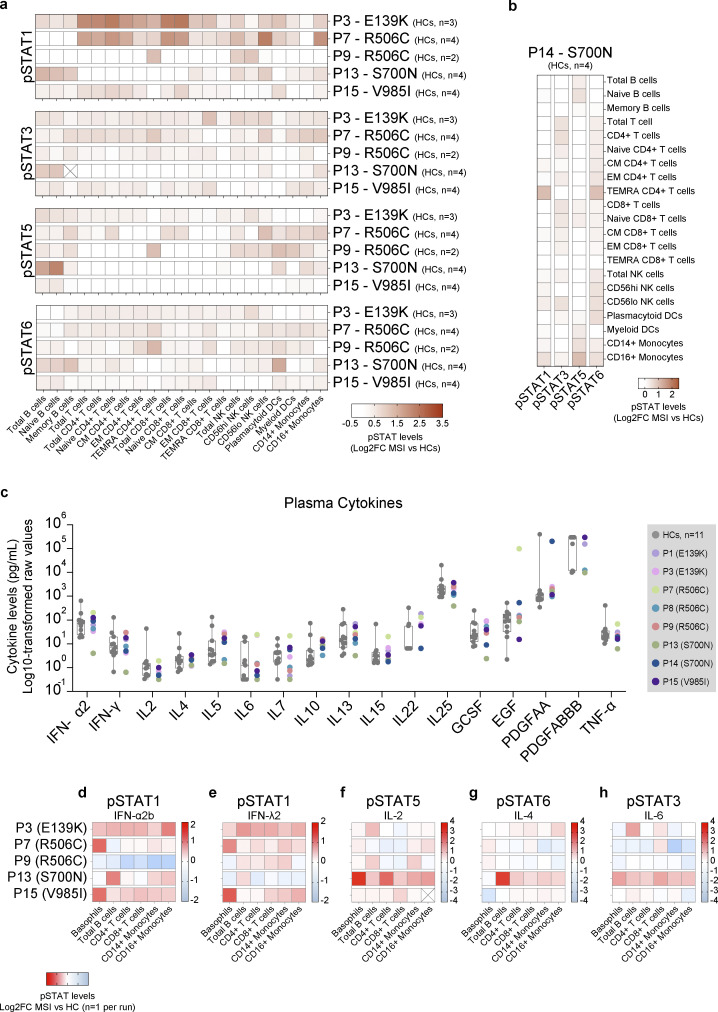
Figure 5.
Ex vivo assessment of whole blood from individuals with JAK1 variants reveals cell type–specific GoF in STAT phosphorylation. (a) Baseline pSTAT1, 3, 5, and 6 levels in manually gated cells from unstimulated whole blood from individuals with JAK1 variants. Each row represents an individual run with the number of HCs for each run labeled. Manually gated cell types for each run are labeled by column. Cells marked with an X indicate no cells were captured for that run. Results are depicted as log2-transformed fold-change in mean signal intensity (MSI) versus the mean signal intensity of HCs from the same run. Number of HCs for each patient are as follows: P3 n = 3; P7 n = 4; P9 n = 2; P13 n = 4; P15 n = 4. (b) Baseline pSTAT1, 3, 5, and 6 levels in manually gated cells from P14. Results depicted as log2-transformed fold change in mean signal intensity (MSI) compared with the average of (HCs from the same run). Each row represents an individual run with HC (n = 4). (c) Multiplex Luminex assay on plasma from individuals with JAK1 variants (n = 8) and HCs (n = 11). Results are expressed as the log10-transformed raw values (pg/ml). All results depicted are from a single run. Gray boxes represent mean ± SD, whiskers represent minimum to maximum range of HCs. For panels a and b: CM = central memory; EM = effector memory; TEMRA = T effector memory CD45RA+; NKT = natural killer T cell; NK = natural killer, DC = dendritic cells. (d–h) Canonical pSTAT levels in stimulated whole blood from individuals with JAK1 variants. Cytokine concentrations as follows: IFN-α2b (P3 = 100 IU/ml; all other patients = 1,000 IU/ml), IFN-λ2, IL-2, IL4, or IL-6 (P3 = 10 ng/ml; all other patients = 100 ng/ml). Each row represents an individual run. Manually gated cell types for each run are labeled by column. Cells marked with an X indicate no cells were captured for that run. Results expressed as log2-transformed fold-change in mean signal intensity versus mean signal intensity of stimulated HCs from the same run (n = 1 HC per run).

