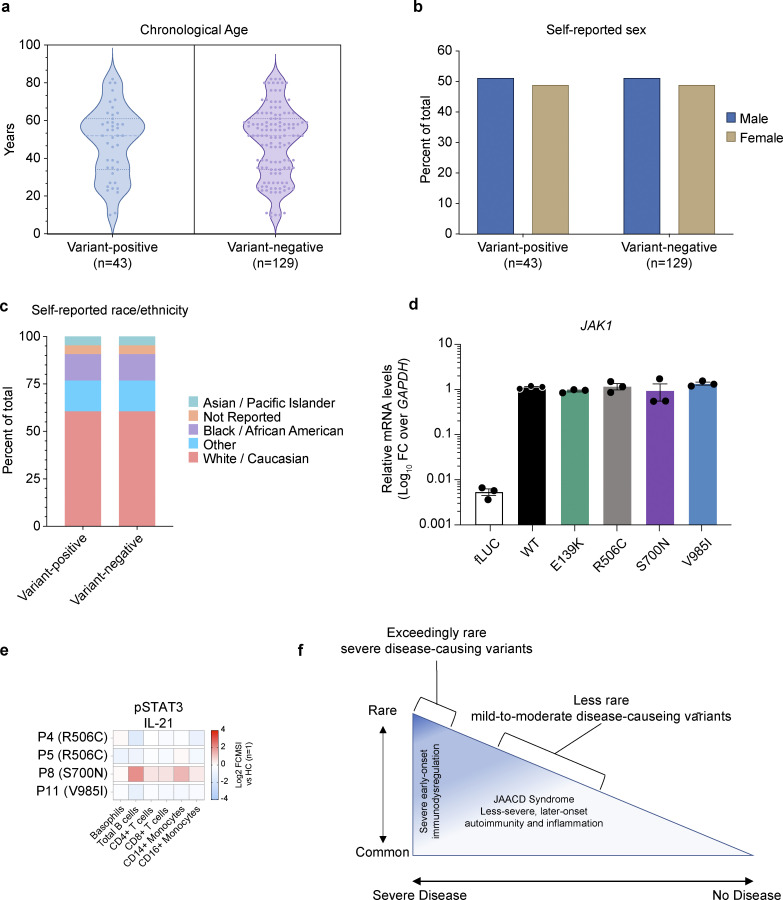
Figure S1.
Demographics of individuals included in a systematic review of EHRs, in vitro, and ex vivo assessment of JAK1 variants. (a) Chronological age in years (calculated from the date of birth) of each JAK1 variant-positive and variant-negative individual at the time of systematic review (2022). Each dot represents a single subject; the width of the shaded area is proportionate to the number of points at that age. Dotted lines delineate quartiles; middle dotted line represents median age. (b) Sex (self-reported) for variant-positive and variant-negative individuals at the time of systematic review (2022). Proportions represented as percent of the total for each genotype. (c) Self-reported race/ethnicity for variant-positive and variant-negative individuals at the time of systematic review (2023). Proportions represented as percent of total for each genotype status. (d) JAK1 mRNA levels in stably transduced U4C cells expressing doxycycline-inducible negative control (fLUC) or JAK1 constructs. JAK1 levels are represented as log10-transformed RNA levels, normalized to the endogenous control transcript, GAPDH. Each individual point represents the average of technical triplicates from a single well (n = 3 wells per variant). Lines and whiskers represent the mean ± SEM from three wells. Representative data shown from three independent experiments for each variant. (e) Canonical pSTAT3 signaling in patient whole blood stimulated with IL-21 (100 ng/ml). Results expressed as log2-transformed fold-change versus stimulated HCs (n = 1 per run). (f) Rare-to-common JAK1 GoF variants lie on a correlated frequency and phenotype spectrum with JAACD syndrome accounting for more common presentations that are often less severe and later onset.

