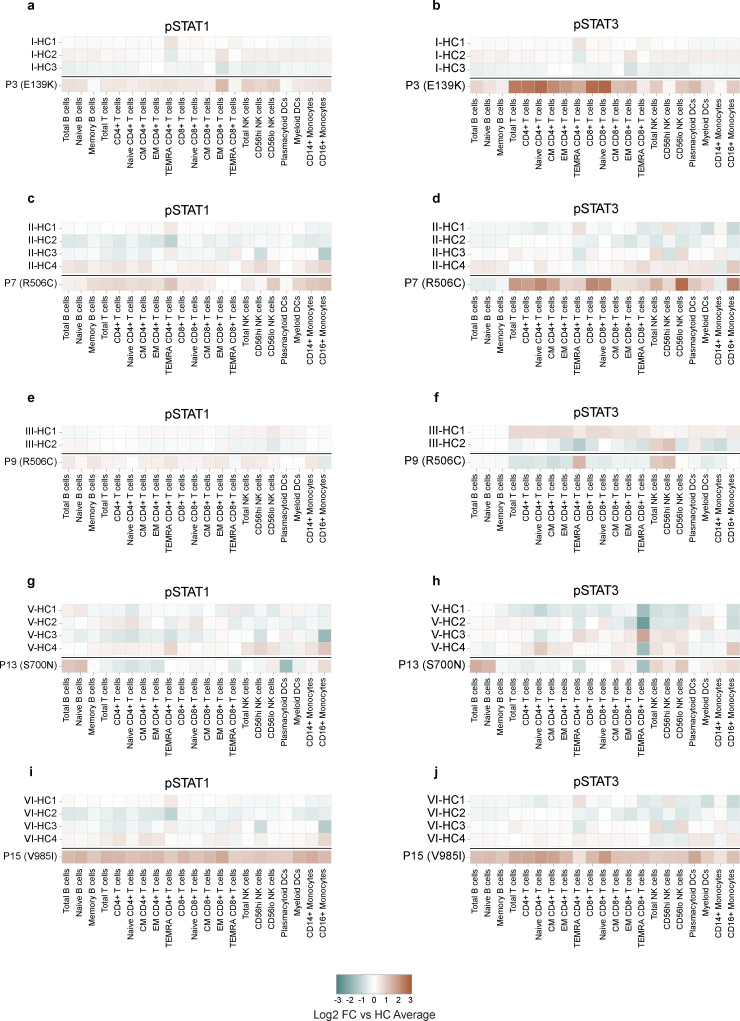
Figure S2.
Ex vivo assessment baseline pSTAT levels compared to individual healthy controls from the same run. (a–j) pSTAT1 (left) and pSTAT3 (right) levels in manually gated cells from unstimulated whole blood from individuals with JAK1 variants encoding JAK1 E139K (a and b), R506C (c and d), R506C (e and f), S700N (g and h), or V985I (i and j). Each panel represents a single run with the corresponding HCs labeled accordingly. Results expressed as log2-transformed fold-change in mean signal intensity (MSI) compared with the average of HCs for that run. HC counts are as follows: P3 n = 3; P7 n = 4; P9 n = 2; P13 n = 4; P14 n = 4; P15 n = 4.

