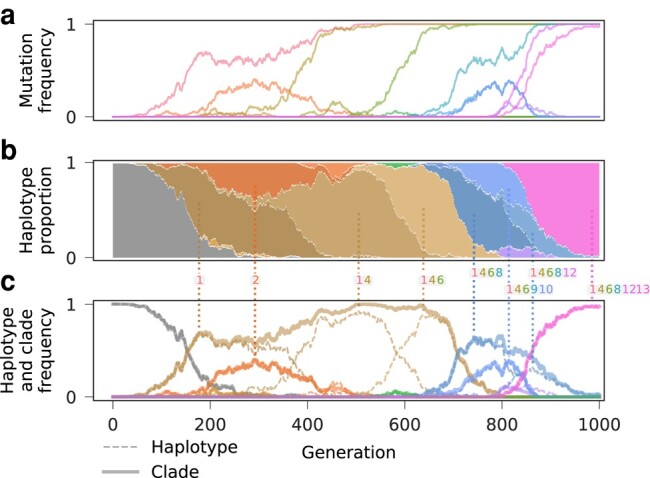
Fig. 2.

Clonal structure is accurately recovered from simulated allele frequency trajectories. a) Allele frequency trajectories for 13 mutations that occurred in an example simulation and exceeded a frequency threshold of 5%. Six mutations eventually fixed in the population, while the rest were lost. These data serve as input for our method. b) The succession of true, underlying haplotype frequency trajectories. Haplotypes inferred to be in the same clade are colored with the same hue and saturation, but different brightness. c) True haplotype frequency trajectories versus reconstructed clade frequency trajectories. Reconstructed clades can consist of a single haplotype, e.g. the final dominant clade, or several haplotypes that emerge consecutively on top of their predecessors.
