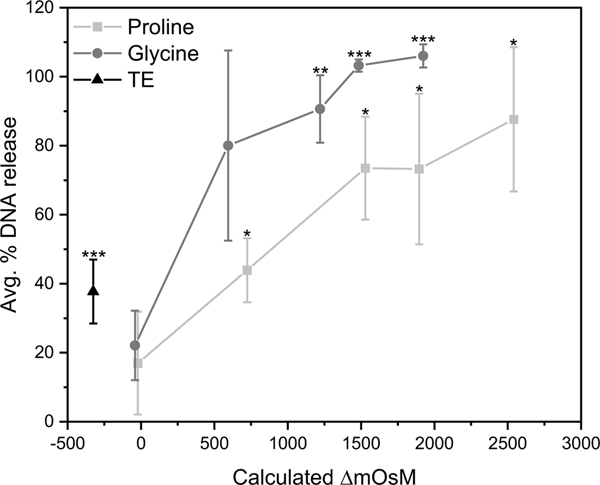
Figure 4 –
Percent DNA release versus change in solution osmolarity. Note that 0.30 M solutions of glycine and proline in 1x TE were not exactly iso-osmotic with the control (10% trehalose in 1x TE), possibly contributing to the moderate, though statistically insignificant, DNA loss seen near ΔmOsM of zero. Asterisks denote significance for sample compared to DNA release into 10% trehalose solution. * p-value < 0.05, ** p-value < 0.01, *** p-value < 0.001. Error bars represent the standard deviation of three independent replicates.

