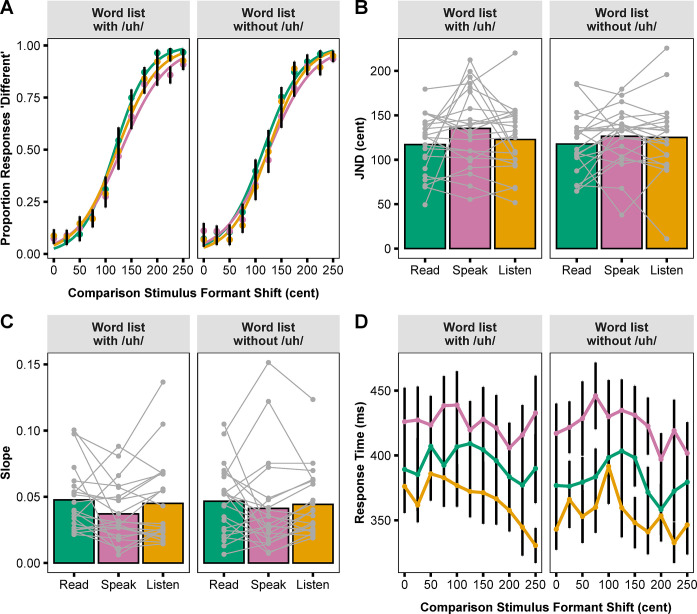
Fig 3. Formant discrimination task results.
(A) Logistic curves fitted to group averaged data for the proportion of “Different” responses by condition and word list. (B) Mean and individual participant JNDs by condition and word list. (C) Mean and individual participant slopes by condition and word list. JND and slope were calculated from the logistic curves fitted to each participant’s responses in each task. (D) Mean keypress response time at each formant shift level of the comparison stimulus by condition and word list. Error bars correspond to standard errors.

