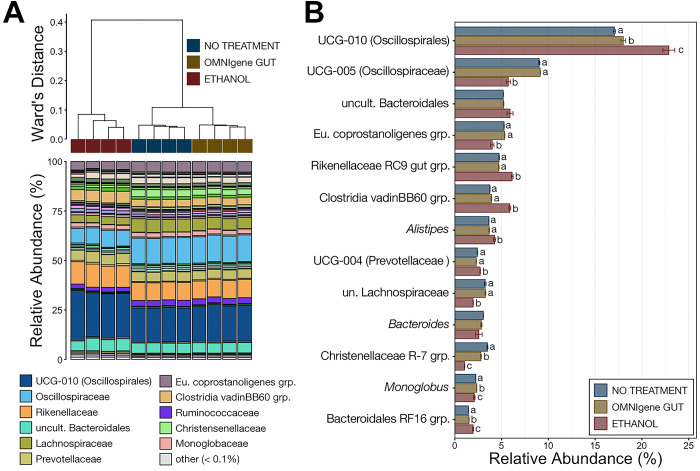
Fig 4.
A) The relatedness of microbial communities from samples extracted immediately after collection and stabilized with OMNIgene®•GUT solution, 100% ethanol, or given no stabilization solution (no treatment). Hierarchal clustering was performed on generalized UniFrac distances using Ward’s agglomeration method. The bar plot illustrates the relative abundance of microbial families within each individual family. The ten most abundant families are displayed in the legend. B) Barplots demonstrating the relative abundance of the 13 genera comprising greater than 1% of the overall microbial community across all samples extracted immediately after collection. Error bars represent standard error of the mean and significant differences in the relative abundance of genus between treatments are illustrated by different letters (pairwise Wilcoxon rank-sum with Benjamini-Hochberg, n = 4, p < 0.05).

